
Quick Disconnect Flow Rate: Pressure Drop Curves and Kv/Cv Calculations
A quick disconnect's flow capacity depends on allowable pressure drop, tubing size, valve configuration and fluid properties. Start with the required flow, then use a flow–pressure drop curve or a Kv/Cv estimate to check the pressure loss against the system's available pressure. Using FOREACH Q20, Q40 and Q60 couplings, this guide explains curve reading, calculations and practical selection for pump suction lines and multiple supply branches.
For low-viscosity liquids similar to water in turbulent flow, estimate pressure drop with ΔP ≈ SG × (Q ÷ Kv)², or flow at a given pressure drop with Q ≈ Kv × √(ΔP ÷ SG). Q is in m³/h, ΔP in bar and SG is specific gravity. The following sections provide approximate curve readings, estimated Kv/Cv values and worked examples, with guidance on valves, viscosity and installation position.
01What determines flow through a quick disconnect coupling?
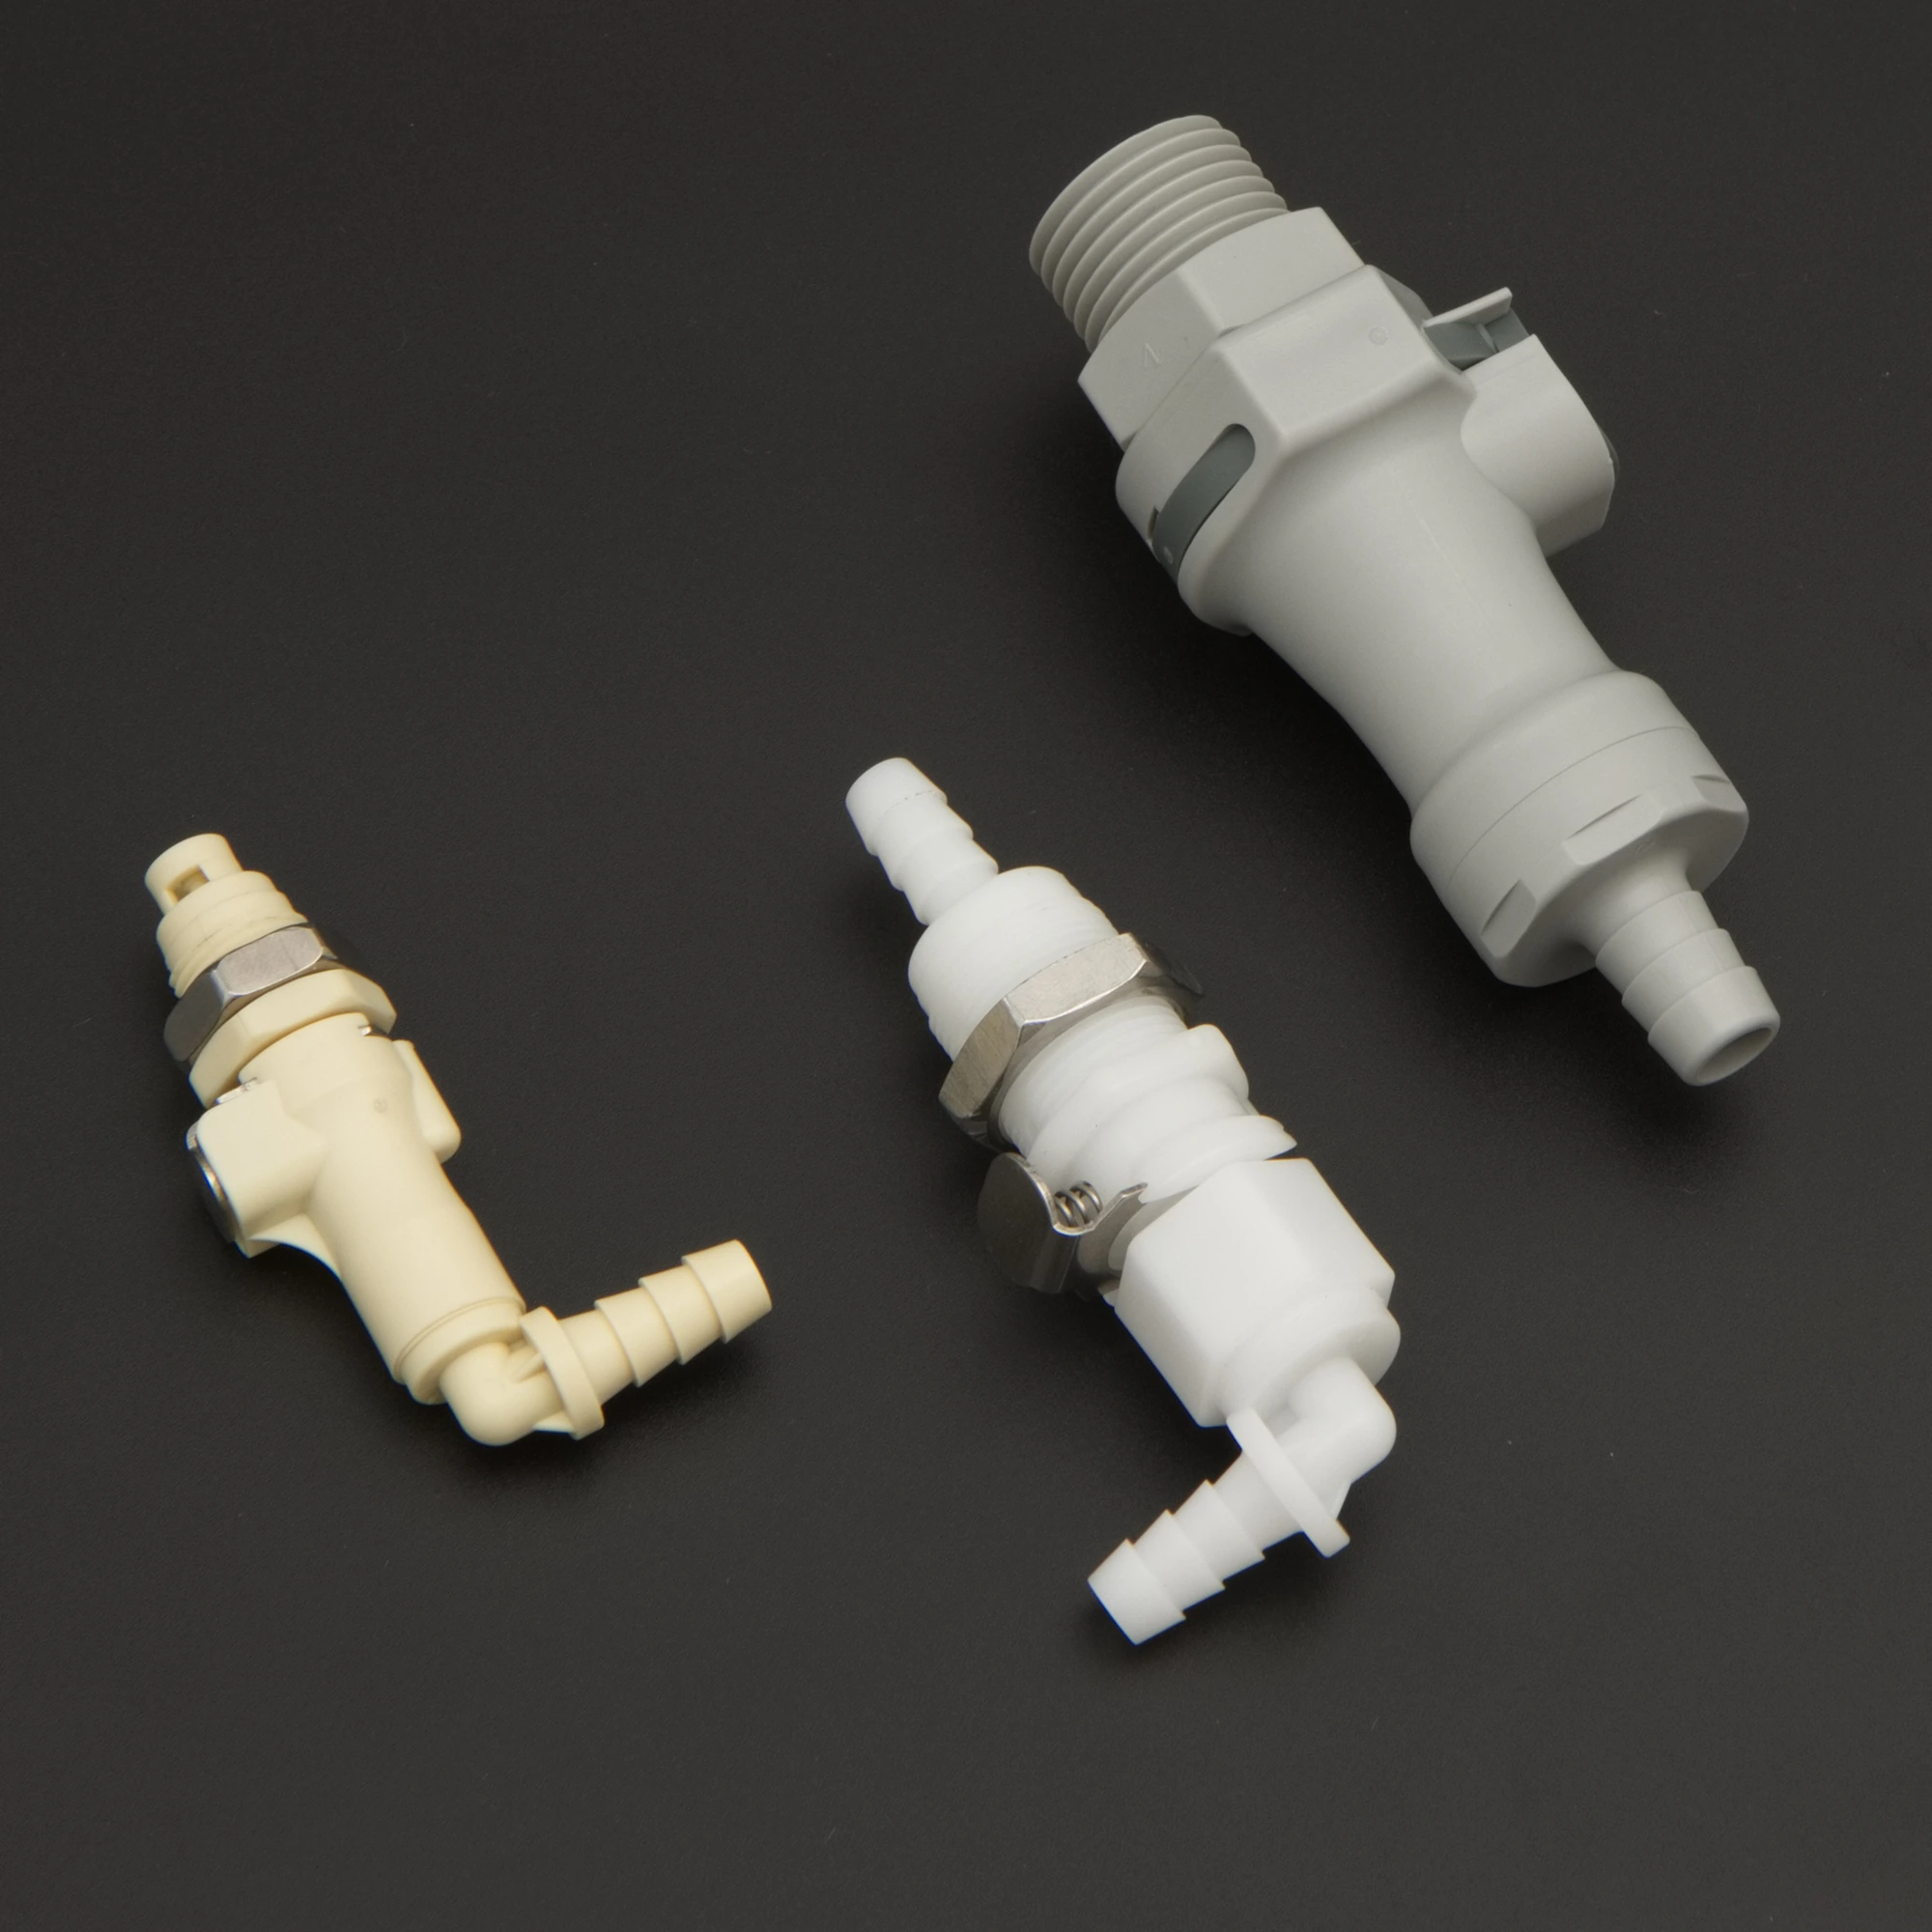
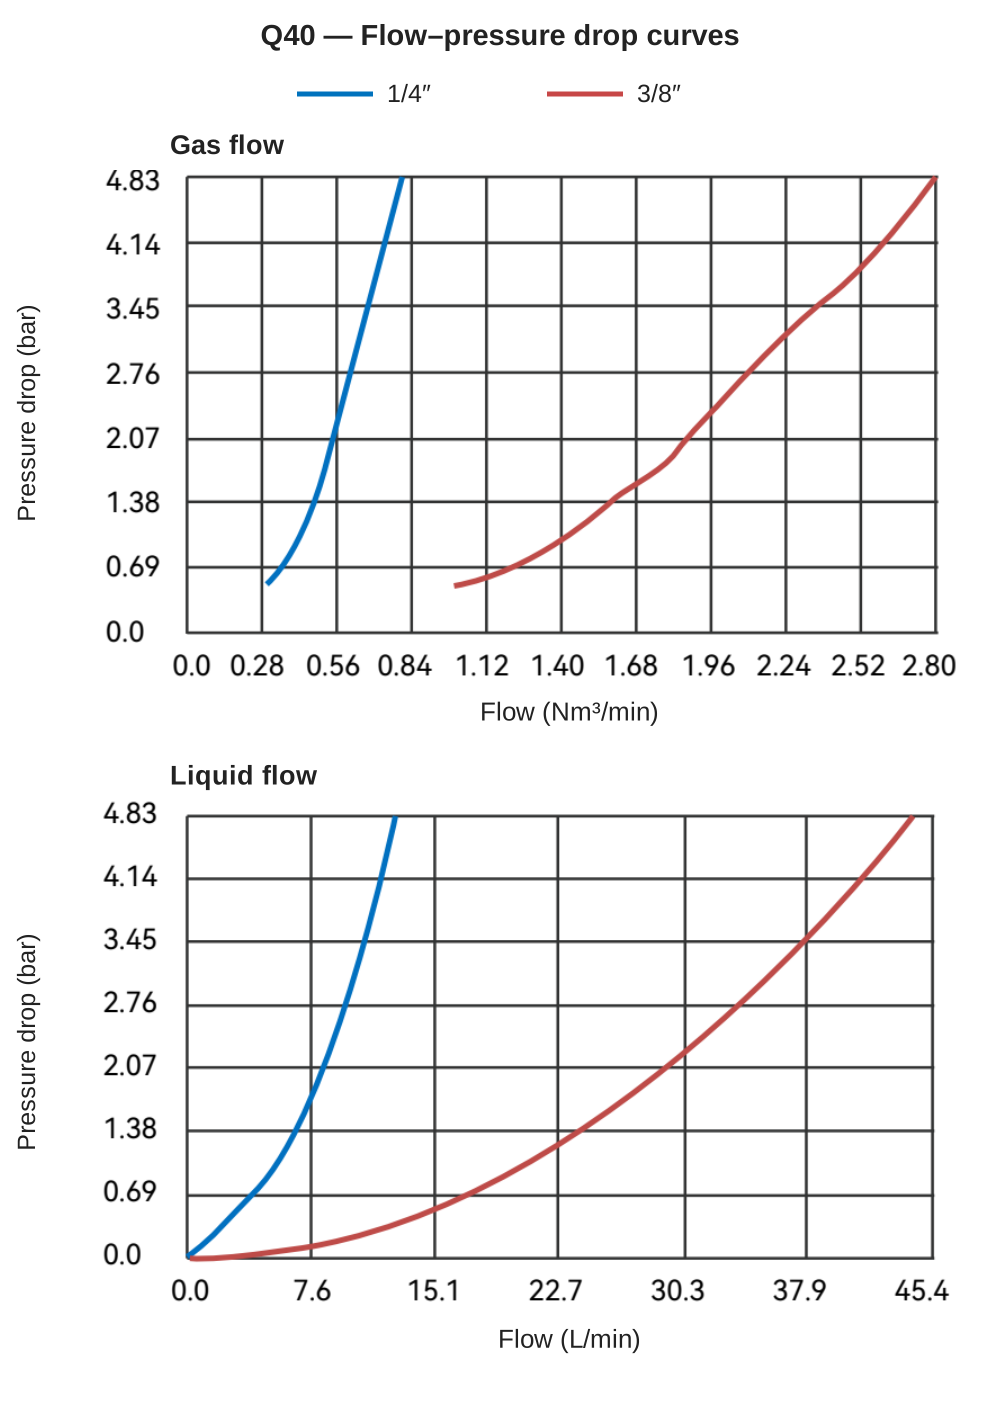
The pump or pressure source drives the flow; the coupling introduces a pressure loss. As flow increases, so does the pressure drop across the coupling. Under typical turbulent-flow conditions, pressure drop varies approximately with the square of flow. On the Q40 3/8″ curve, the drop is about 0.23 bar at 10 L/min and 0.95 bar at 20 L/min: twice the flow gives nearly four times the pressure drop.
At a given flow rate, the main factors are:
- Tubing size: within a series, changing from a 1/8″ to a 1/4″ connection can reduce pressure drop by more than an order of magnitude.
- Valve configuration: a non-valved straight-through passage offers the least restriction; shutoff valves and springs occupy part of the flow path.
- Termination: straight hose barbs, elbows and threaded ends have different internal passages.
- Fluid properties: higher specific gravity or viscosity increases pressure loss at the same flow.
Tubing ID is the inside diameter of the mating tube, not the smallest bore inside the coupling. See the sizing discussion in What Is a Quick Disconnect Fitting?
02How do you read a quick disconnect flow–pressure drop curve?
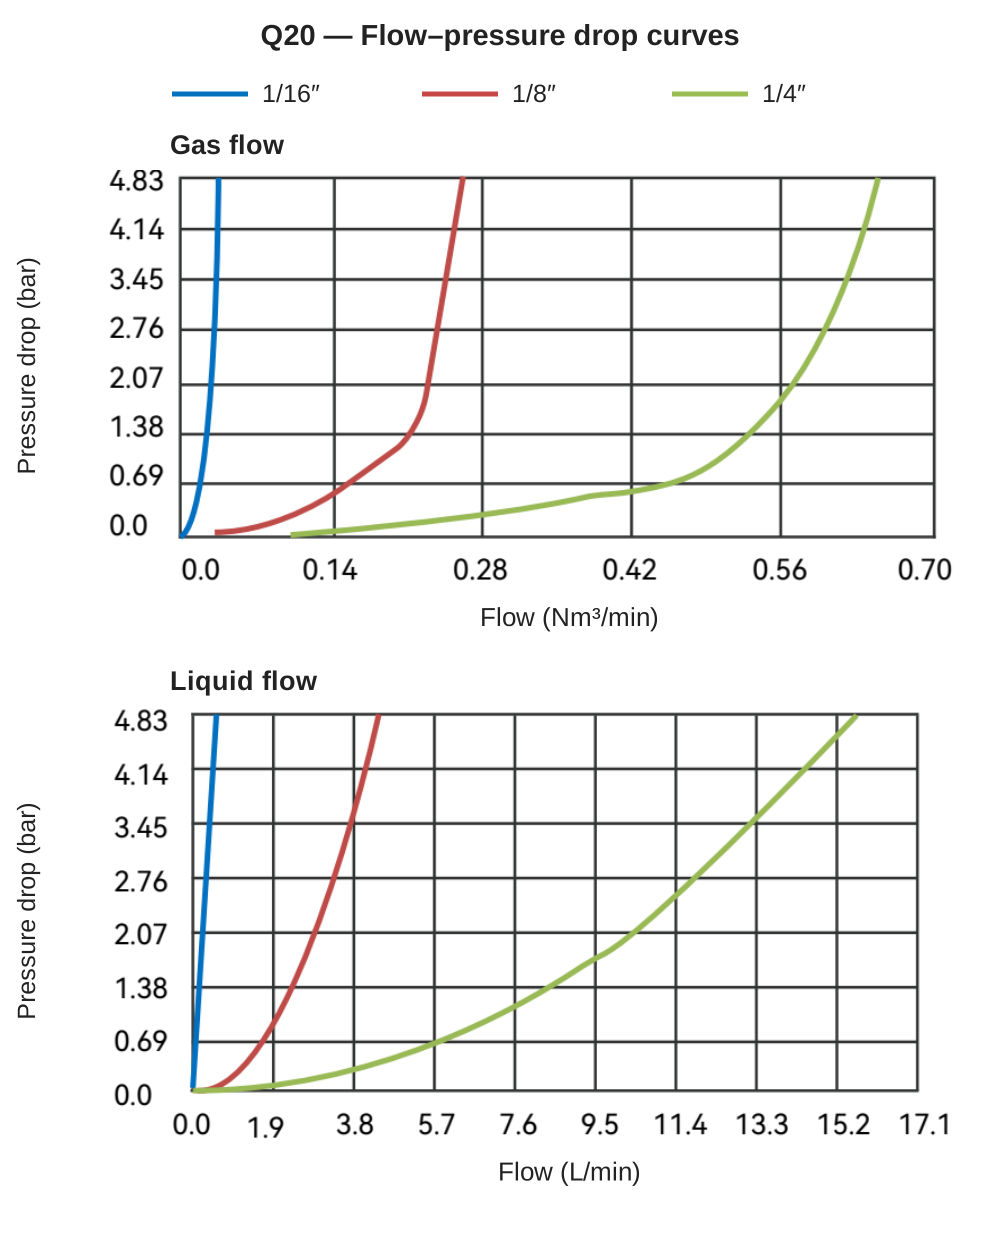
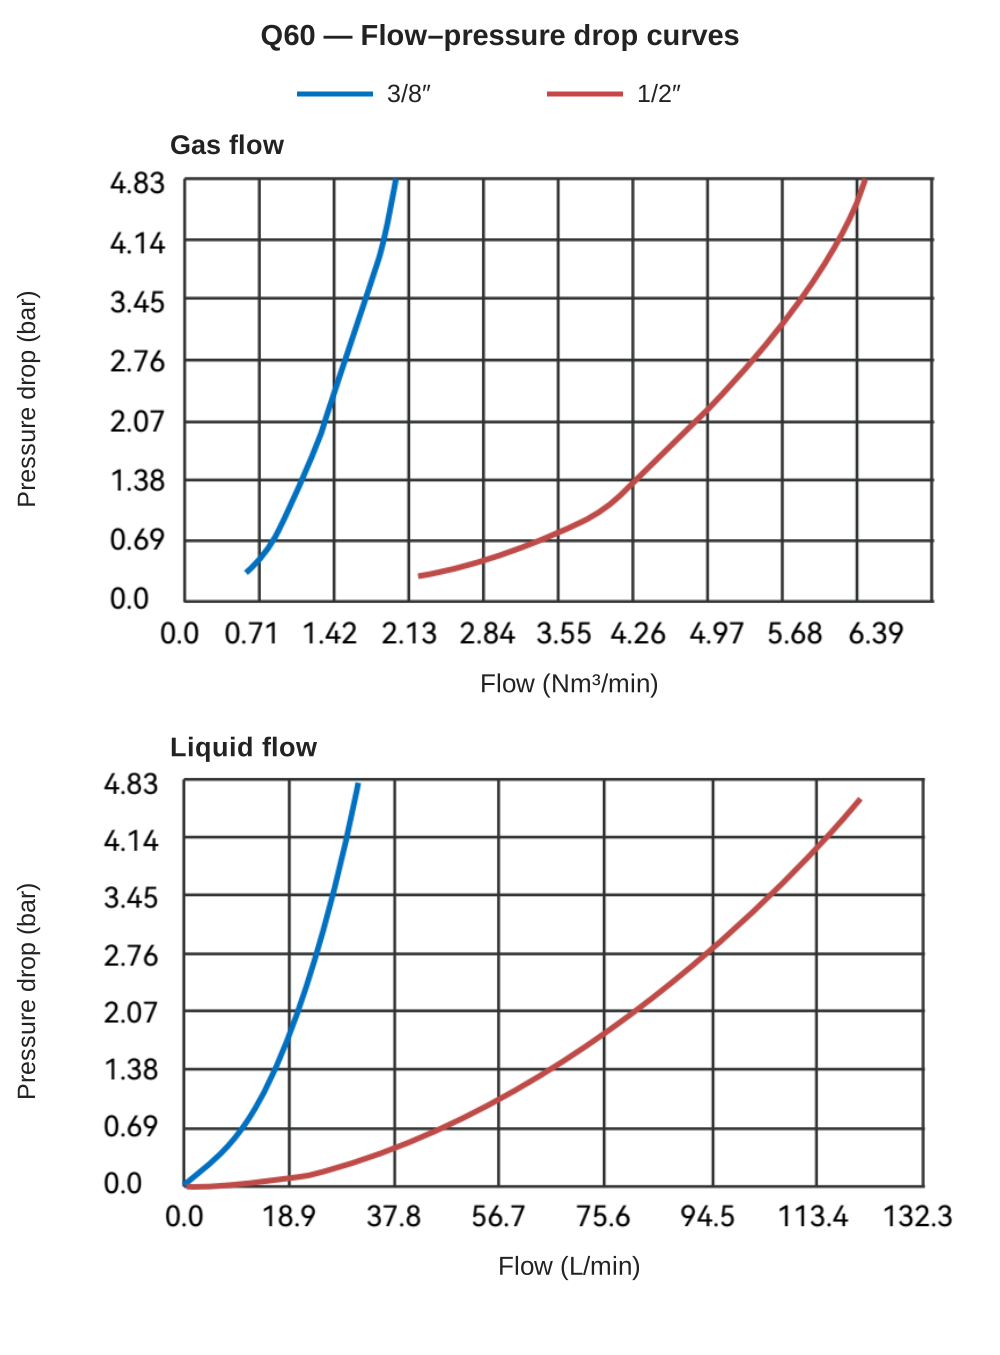
The horizontal axis shows flow: L/min for liquid and Nm³/min for gas. The vertical axis shows pressure drop across the coupling in bar. Each curve represents a tubing connection size. Read the chart in either direction:
- Find pressure drop from flow: move up from the target flow to the appropriate curve, then left to the pressure-drop axis.
- Find flow from allowable pressure drop: move right from the pressure-drop value to the curve, then down to the flow axis.
| Chart feature | What it represents | What it does not represent |
|---|---|---|
| Vertical-axis pressure drop | Pressure loss across the coupling | Pump discharge pressure or the coupling's working-pressure rating |
| Highest flow-axis tick | The plotted range | A rated flow capacity |
| Gas-flow curve | Gas volume flow referred to standard conditions | A basis for converting gas flow into liquid flow |
Useful unit conversions: 0.69 bar is approximately 10 psi; 1.9 L/min is approximately 0.5 US gpm; 4.83 bar is approximately 70 psi.
03Q20, Q40 and Q60 flow–pressure drop reference tables
These tables contain approximate readings from the liquid-flow curves for initial selection and tubing-size comparisons within a series. Kv and Cv are estimates derived from the curves for preliminary calculations within their applicable range. Curve readings and coefficient calculations need not agree at every point; acceptance testing should use the complete connected assembly.
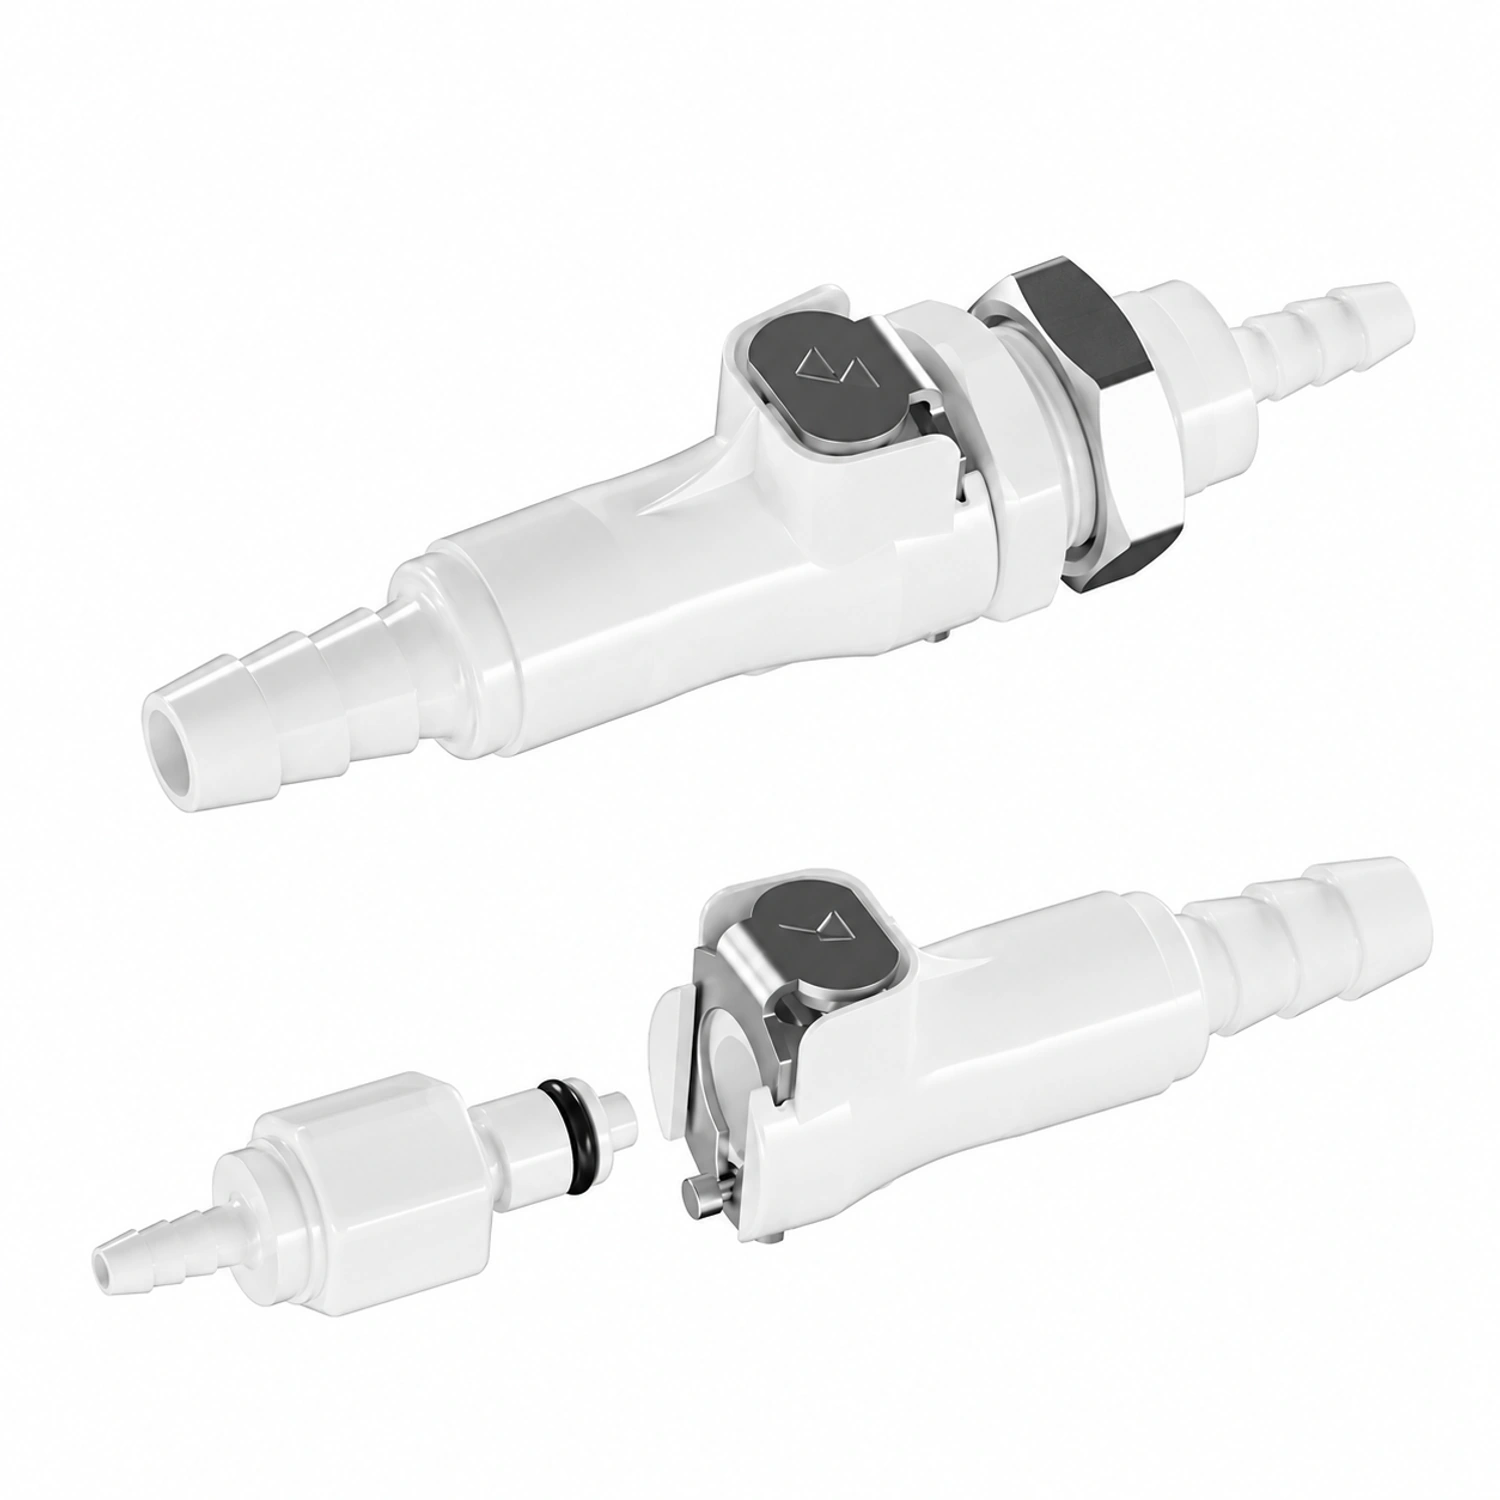
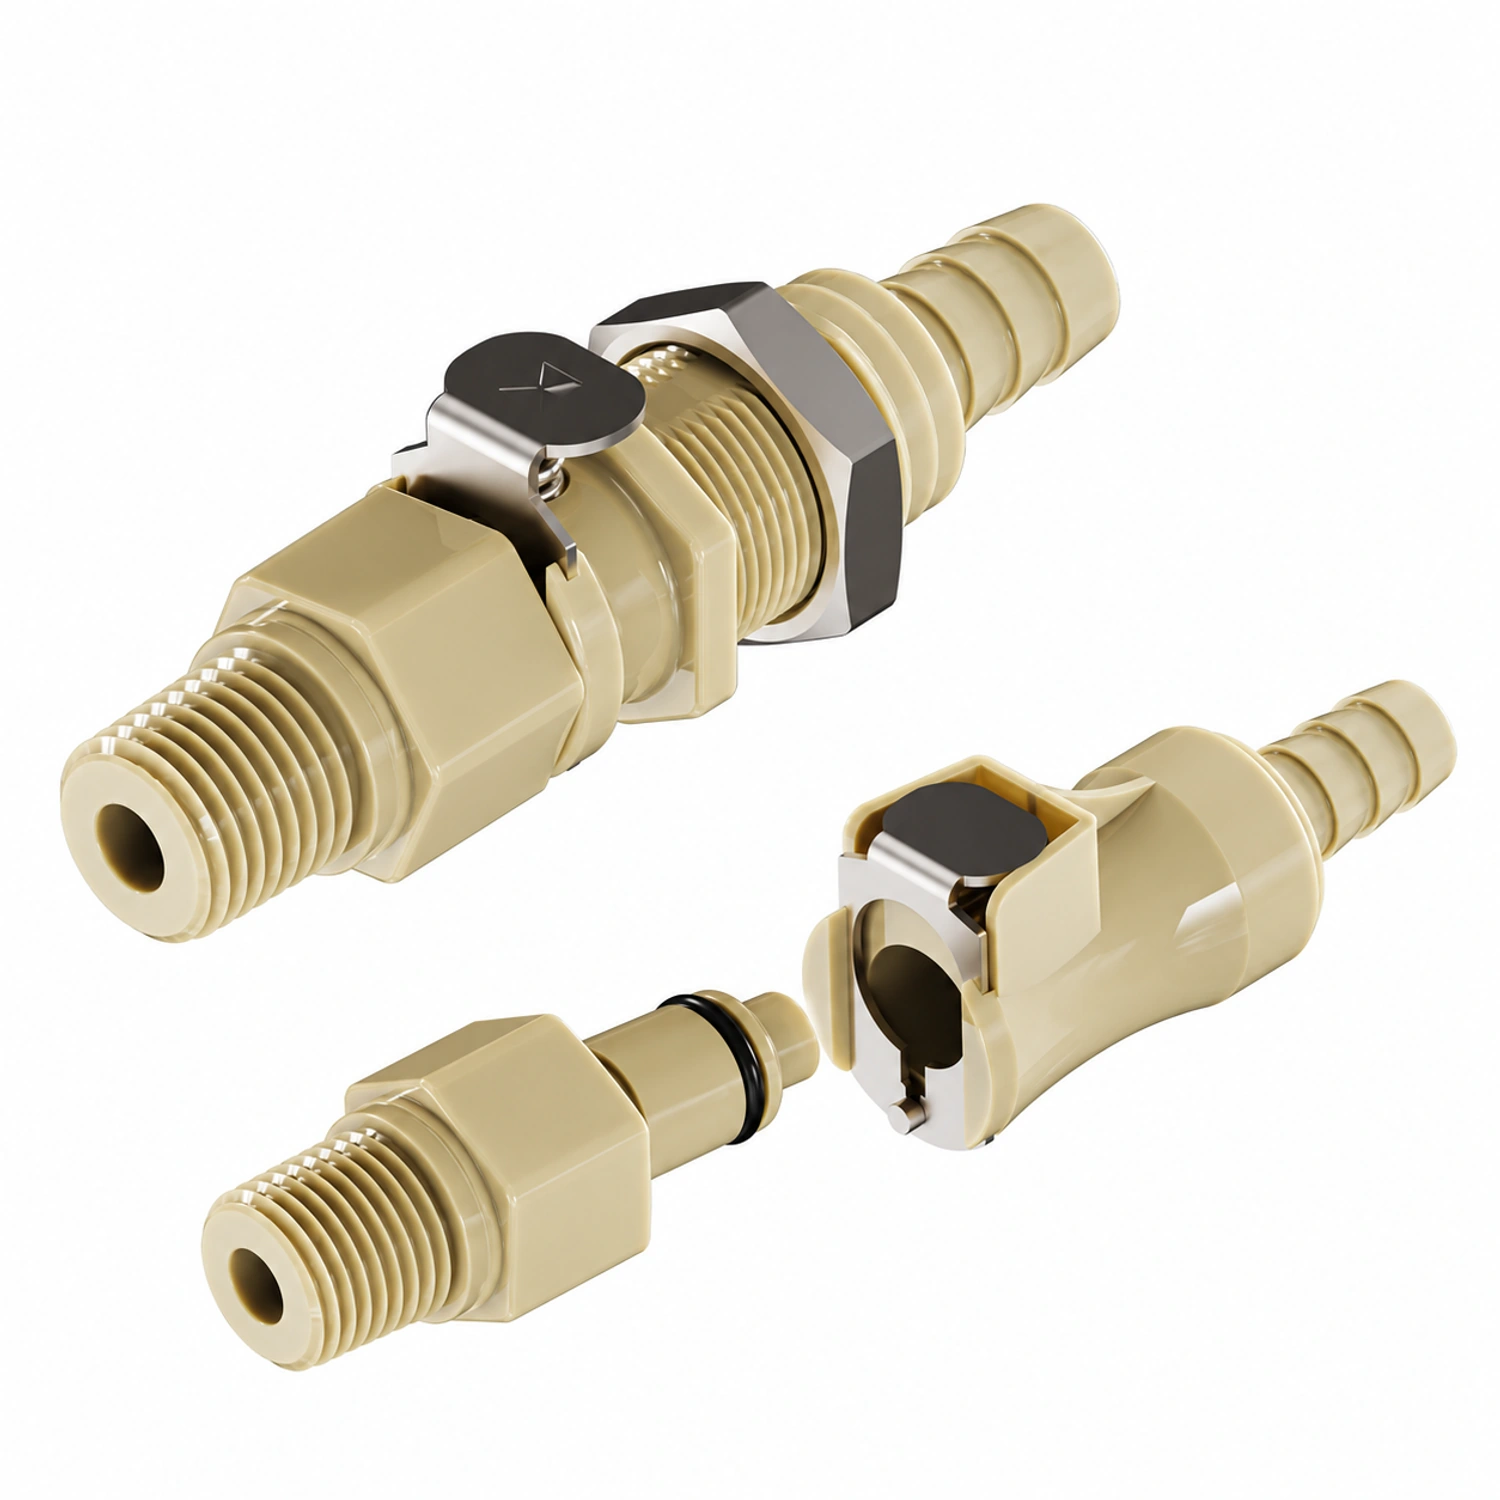
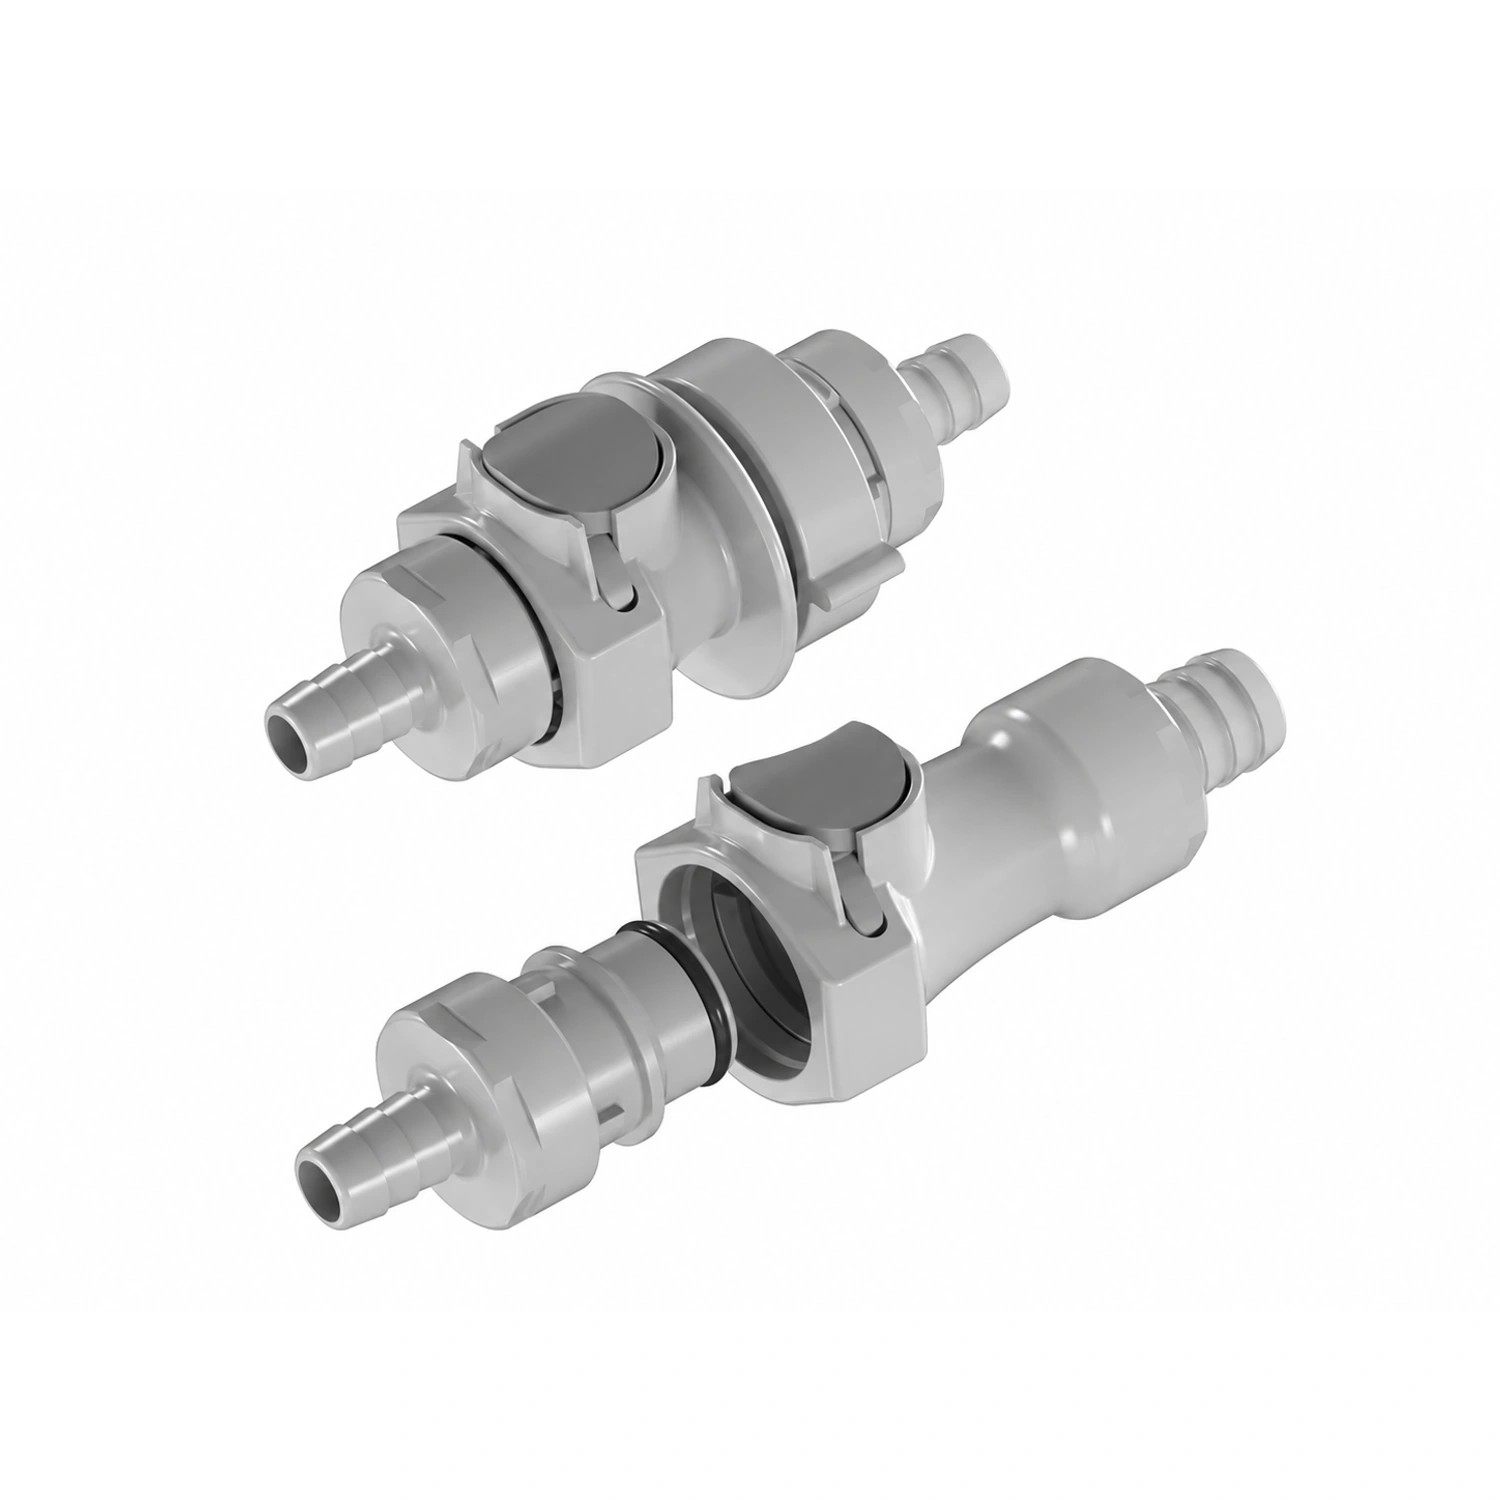
Q20 series: tubing ID 1.6–6.4 mm
| Flow (L/min) | 1/16″ (1.6 mm) | 1/8″ (3.2 mm) | 1/4″ (6.4 mm) |
|---|---|---|---|
| 0.2 | ≈1.9 | <0.1 | <0.05 |
| 0.5 | ≈4.3 | <0.1 | <0.05 |
| 1 | Outside plotted range | ≈0.2 | <0.05 |
| 2 | Outside plotted range | ≈1.0 | ≈0.07 |
| 4 | Outside plotted range | ≈4.0 | ≈0.3 |
| 8 | Outside plotted range | Outside plotted range | ≈1.3 |
| 12 | Outside plotted range | Outside plotted range | ≈2.8 |
| Flow at 1 bar pressure drop (L/min) | ≈0.1 | ≈2.0 | ≈7.1 |
| Estimated Kv / Cv | Curve too steep for a useful estimate | 0.12 / 0.14 | 0.43 / 0.49 |
“Outside plotted range” means that pressure drop at that flow exceeds the chart limit of 4.83 bar.
The Q20 1/16″ connection is suited to very low flows: pressure drop reaches about 1 bar at 0.1 L/min and exceeds 4 bar at 0.5 L/min. For reservoir supply or wash circuits requiring more than 1 L/min, evaluate the 1/8″ or 1/4″ connection first.
Q40 series: tubing ID 6.4–9.5 mm
| Flow (L/min) | 1/4″ (6.4 mm) | 3/8″ (9.5 mm) |
|---|---|---|
| 2 | ≈0.3 | <0.05 |
| 4 | ≈0.7 | <0.05 |
| 8 | ≈1.9 | ≈0.14 |
| 12 | ≈4.3 | ≈0.33 |
| 20 | Outside plotted range | ≈1.0 |
| 30 | Outside plotted range | ≈2.2 |
| 40 | Outside plotted range | ≈3.9 |
| Flow at 1 bar pressure drop (L/min) | ≈5.4 | ≈20 |
| Estimated Kv / Cv | 0.35 / 0.40 | 1.22 / 1.41 |
Q60 series: tubing ID 9.5–19.0 mm
| Flow (L/min) | 3/8″ (9.5 mm) | 1/2″ (12.7 mm) |
|---|---|---|
| 5 | ≈0.3 | <0.05 |
| 10 | ≈0.65 | <0.05 |
| 20 | ≈2.0 | ≈0.10 |
| 30 | ≈4.4 * | ≈0.27 |
| 50 | Outside plotted range | ≈0.8 |
| 80 | Outside plotted range | ≈2.0 |
| 100 | Outside plotted range | ≈3.2 |
| Flow at 1 bar pressure drop (L/min) | ≈13 | ≈56 |
| Estimated Kv / Cv | 0.85 / 0.98 | 3.4 / 3.9 |
* This pressure drop exceeds the Q60-PP working-pressure rating of 4.2 bar. The point illustrates the curve trend only.
These Q60 curves cover 3/8″ and 1/2″ tubing connections; do not extrapolate them to 3/4″ (19.0 mm) by scaling the tube diameter. Q60-PP has a 4.2 bar working-pressure rating. With the downstream side at atmospheric or positive gauge pressure, curve points above that pressure drop are not usable operating conditions.
04Calculating quick disconnect flow and pressure drop with Kv or Cv
Use flow coefficients only within the plotted range and applicable flow conditions. Kv is the water flow in m³/h at a 1 bar pressure drop; Cv is the water flow in US gpm at a 1 psi pressure drop. The conversion is Cv ≈ 1.156 × Kv. Do not extrapolate beyond the chart.
Pressure drop from flow: ΔP = SG × (Q ÷ Kv)²
Flow from allowable pressure drop: Q = Kv × √(ΔP ÷ SG)
Here Q is in m³/h (1 m³/h ≈ 16.7 L/min), ΔP is in bar and SG is specific gravity, equal to 1 for water.
Example 1 — A wash circuit needs 12 L/min through a Q40 3/8″ connection (Kv ≈ 1.22), with liquid specific gravity taken as 1.0. Convert 12 L/min to 0.72 m³/h: ΔP = 1.0 × (0.72 ÷ 1.22)² ≈ 0.35 bar, close to the table reading of 0.33 bar.
Example 2 — A branch allows only 0.5 bar across a Q20 1/4″ connection (Kv ≈ 0.43). Q = 0.43 × √0.5 ≈ 0.30 m³/h, or approximately 5 L/min.
Example 3 — Two identical coupling pairs in series produce twice the pressure drop of one pair at the same flow. Their combined Kv is the single-pair Kv divided by √2. For different components in series: 1/Kv_total² = 1/Kv₁² + 1/Kv₂² + … .
Enter Cv in a Cv row of the FOREACH Fluid Resistance Calculator to include the coupling alongside tubing and valves in a system pressure-drop calculation. The calculator guide in Further Reading explains the workflow.
These equations apply to liquids with viscosity close to water under turbulent conditions. At very low flow or higher viscosity, flow can approach the laminar regime, where pressure drop is closer to a linear function of flow. The square-law estimate then loses accuracy: test with the actual fluid. The Kv/Cv values here are curve-derived estimates for preliminary sizing.
05How do shutoff valves affect quick disconnect pressure drop?
A valved coupling half closes its passage automatically when disconnected. The valve and spring also restrict the passage when connected, increasing pressure drop relative to a comparable non-valved straight-through design. With valves in both halves, two valve elements remain in the flow path, generally producing the greatest restriction.
When flow margin is limited:
- Use a valved half only on the side that must shut off after disconnection; use a non-valved half on the other side if the application permits.
- If both sides require shutoff, consider a larger tubing connection before sacrificing the required valves.
- Incomplete engagement can leave the valves partly closed and reduce flow sharply. Check that the halves are fully latched before investigating other causes.
For retained liquid and spillage after disconnection, see What Is a Quick Disconnect Fitting?.
06How do model codes match the curve labels?
| Size code | Tubing ID | Curve legend | Series |
|---|---|---|---|
| 01 | 1.6 mm | 1/16″ | Q20 |
| 02 | 3.2 mm | 1/8″ | Q20 |
| 03 | 4.8 mm | 3/16″ (not covered by these curves) | Q20 |
| 04 | 6.4 mm | 1/4″ | Q20、Q40 |
| 06 | 9.5 mm | 3/8″ | Q40、Q60 |
| 08 | 12.7 mm | 1/2″ | Q60 |
| 12 | 19.0 mm | 3/4″ (not covered by these curves) | Q60 |
For Q2004-PNV-SPPE: Q20 identifies the series; 04 means 6.4 mm (1/4″) tubing; P denotes the male half; N means non-panel-mount; V means valved; S, PP and E identify a straight termination, PP housing and EPDM seal. Threaded terminations use a different coding scheme—for example, Q4005 identifies a threaded connection—so check the complete model.
07Why does a pump suction line need a lower coupling pressure drop?
For a vented reservoir, one atmosphere (about 1 bar), plus any positive static head above the pump inlet, is a theoretical pressure-difference limit—not a usable design allowance. The pump's inlet-pressure requirement and losses through tubing and filters reduce the available margin, often leaving only a few tenths of a bar for the coupling. Excessive suction loss reduces delivered flow and encourages dissolved gas to come out of solution.
Select suction-side couplings at a lower pressure drop. At 2 L/min, the Q20 1/8″ connection consumes about 1.0 bar, approaching the theoretical atmospheric limit; the 1/4″ connection consumes about 0.07 bar.
Also check sealing under vacuum. Air admitted during reconnection and the time needed to purge it can change the first delivered volume. Size intermittent wash circuits for the instantaneous flow during the wash step, not average consumption per minute.
08How should a shared inlet coupling be sized for multiple branches?
A coupling at the common inlet carries the sum of the flows in all branches operating at the same time:
Q_inlet = Q_branch1 + Q_branch2 + … (simultaneously active branches only)
For example, three wash branches each needing 0.5 L/min require 1.5 L/min at the common inlet when all run together. Using Kv, a Q20 1/8″ connection gives about 0.56 bar pressure drop; a 1/4″ connection gives about 0.04 bar. On a suction line, evaluate the 1/4″ option first and verify inlet-pressure margin with the complete assembly.
For sequential operation, use the highest single-step demand. Adequate total inlet flow does not guarantee equal branch flows: tubing length, valves and needle orifices create different resistances. Measure delivery at each branch outlet.
09Can gas-flow curves be used for liquids, and how does viscosity matter?
No. Gas curves express volume flow at standard conditions. Gas is compressible, and actual flow also depends on inlet pressure. Gas and liquid follow different flow relationships; unit conversion does not make their curves interchangeable.
Specific gravity is already included in the equations above. Viscosity needs separate attention: glycerol, protein or concentrated-salt formulations can be more viscous than water, and lower temperature can increase viscosity further. Pressure loss can therefore exceed the reference-table values. Test the complete connection with the actual liquid at its operating temperature.
10How do you verify quick disconnect flow and pressure drop after installation?
| Check | Record | Purpose |
|---|---|---|
| Complete configuration | Full models of both halves, valve configuration, tubing ID and length | Compare like-for-like assemblies |
| Coupling pressure drop | Upstream and downstream pressures at target flow; record outlet flow before and after installation as a separate functional check | Check the available pressure allowance |
| One branch operating | Outlet flow, start-up delay and repeatability between cycles | Confirm delivery meets the process demand |
| Simultaneous branch operation | Total flow, branch distribution and pressure drop at the shared inlet | Check flow distribution |
| Suction line | Inlet pressure, bubbles and delivery at low reservoir level | Assess air ingress under vacuum and supply margin |
| After the filter has been in service | Change in outlet flow | Assess long-term flow margin |
| Restart after disconnection | Mating-interface sealing, admitted air and purge recovery time | Assess the effect of servicing on subsequent cycles |
11Further reading on quick disconnect selection
12Quick disconnect flow and pressure drop: FAQs
How do I calculate flow through a quick disconnect?
Set the allowable pressure drop, then calculate Q = Kv × √(ΔP ÷ SG), with Q in m³/h and ΔP in bar. Alternatively, move from that pressure drop to the appropriate curve and read the flow below. Apply the liquid-flow assumptions described above.
What pressure drop is acceptable across a quick disconnect?
There is no universal pass/fail value. Allocate pressure from what the pump can supply at the target flow. On a suction line, usable inlet-pressure margin is particularly limited: an atmosphere plus static head is only a theoretical ceiling for a vented reservoir. Keep coupling losses low.
Does a larger tubing connection always deliver more flow?
Within the same series and valve configuration, a larger connection reduces coupling loss. At 2 L/min, Q20 1/8″ is about 1.0 bar versus 0.07 bar for 1/4″. Tubing, valves and orifices elsewhere still limit system flow, so assess the benefit in the complete circuit.
How do I select a quick disconnect for high flow?
Define target flow, allowable pressure drop and maximum system pressure. Select the mating halves, tubing size and valves, then read pressure drop from the corresponding liquid curve. Check working pressure and temperature as well. For a shared inlet, sum simultaneous branch demands and verify coupling pressure drop and each outlet's flow after installation.
Can the gas-flow curve be used to select a coupling for wash liquid?
No. Use the liquid-flow curve or a Kv estimate followed by testing; gas and liquid flow are governed by different relationships.