
How Much Installed Flow Margin Should a 300 mL/min Miniature Diaphragm Pump Have? A Foreach Example
Flow margin is not found by multiplying the target flow by 1.2 or 1.3 in every case. It is determined by comparing the pump's conservative available flow with the instrument's maximum demand within the same credible worst-case scenario. Testing must also define in advance how measurement uncertainty will be handled and what explicit acceptance criteria will apply.
Different fluid paths consume margin in different ways: filter loading increases pressure drop, the lowest liquid level worsens inlet conditions, and fluid viscosity, power supply, tubing tolerances, pump-sample variation and life stage can also shift the operating point. Subtracting average demand from a free-flow value of 300 mL/min does not yield an installed margin suitable for release.
1. Why a Universal 20% or 30% Margin Is Not Rigorous Enough
A 20%–30% margin can serve as a reminder during conceptual design, but it should not automatically become the release standard for every project. Some instruments are governed mainly by the pressure drop of a filter near the end of its life, while others are governed by the lowest liquid level, low-temperature viscosity or voltage at the pump terminals. Because the sources of variation and the acceptable consequences differ, the required margin also differs.
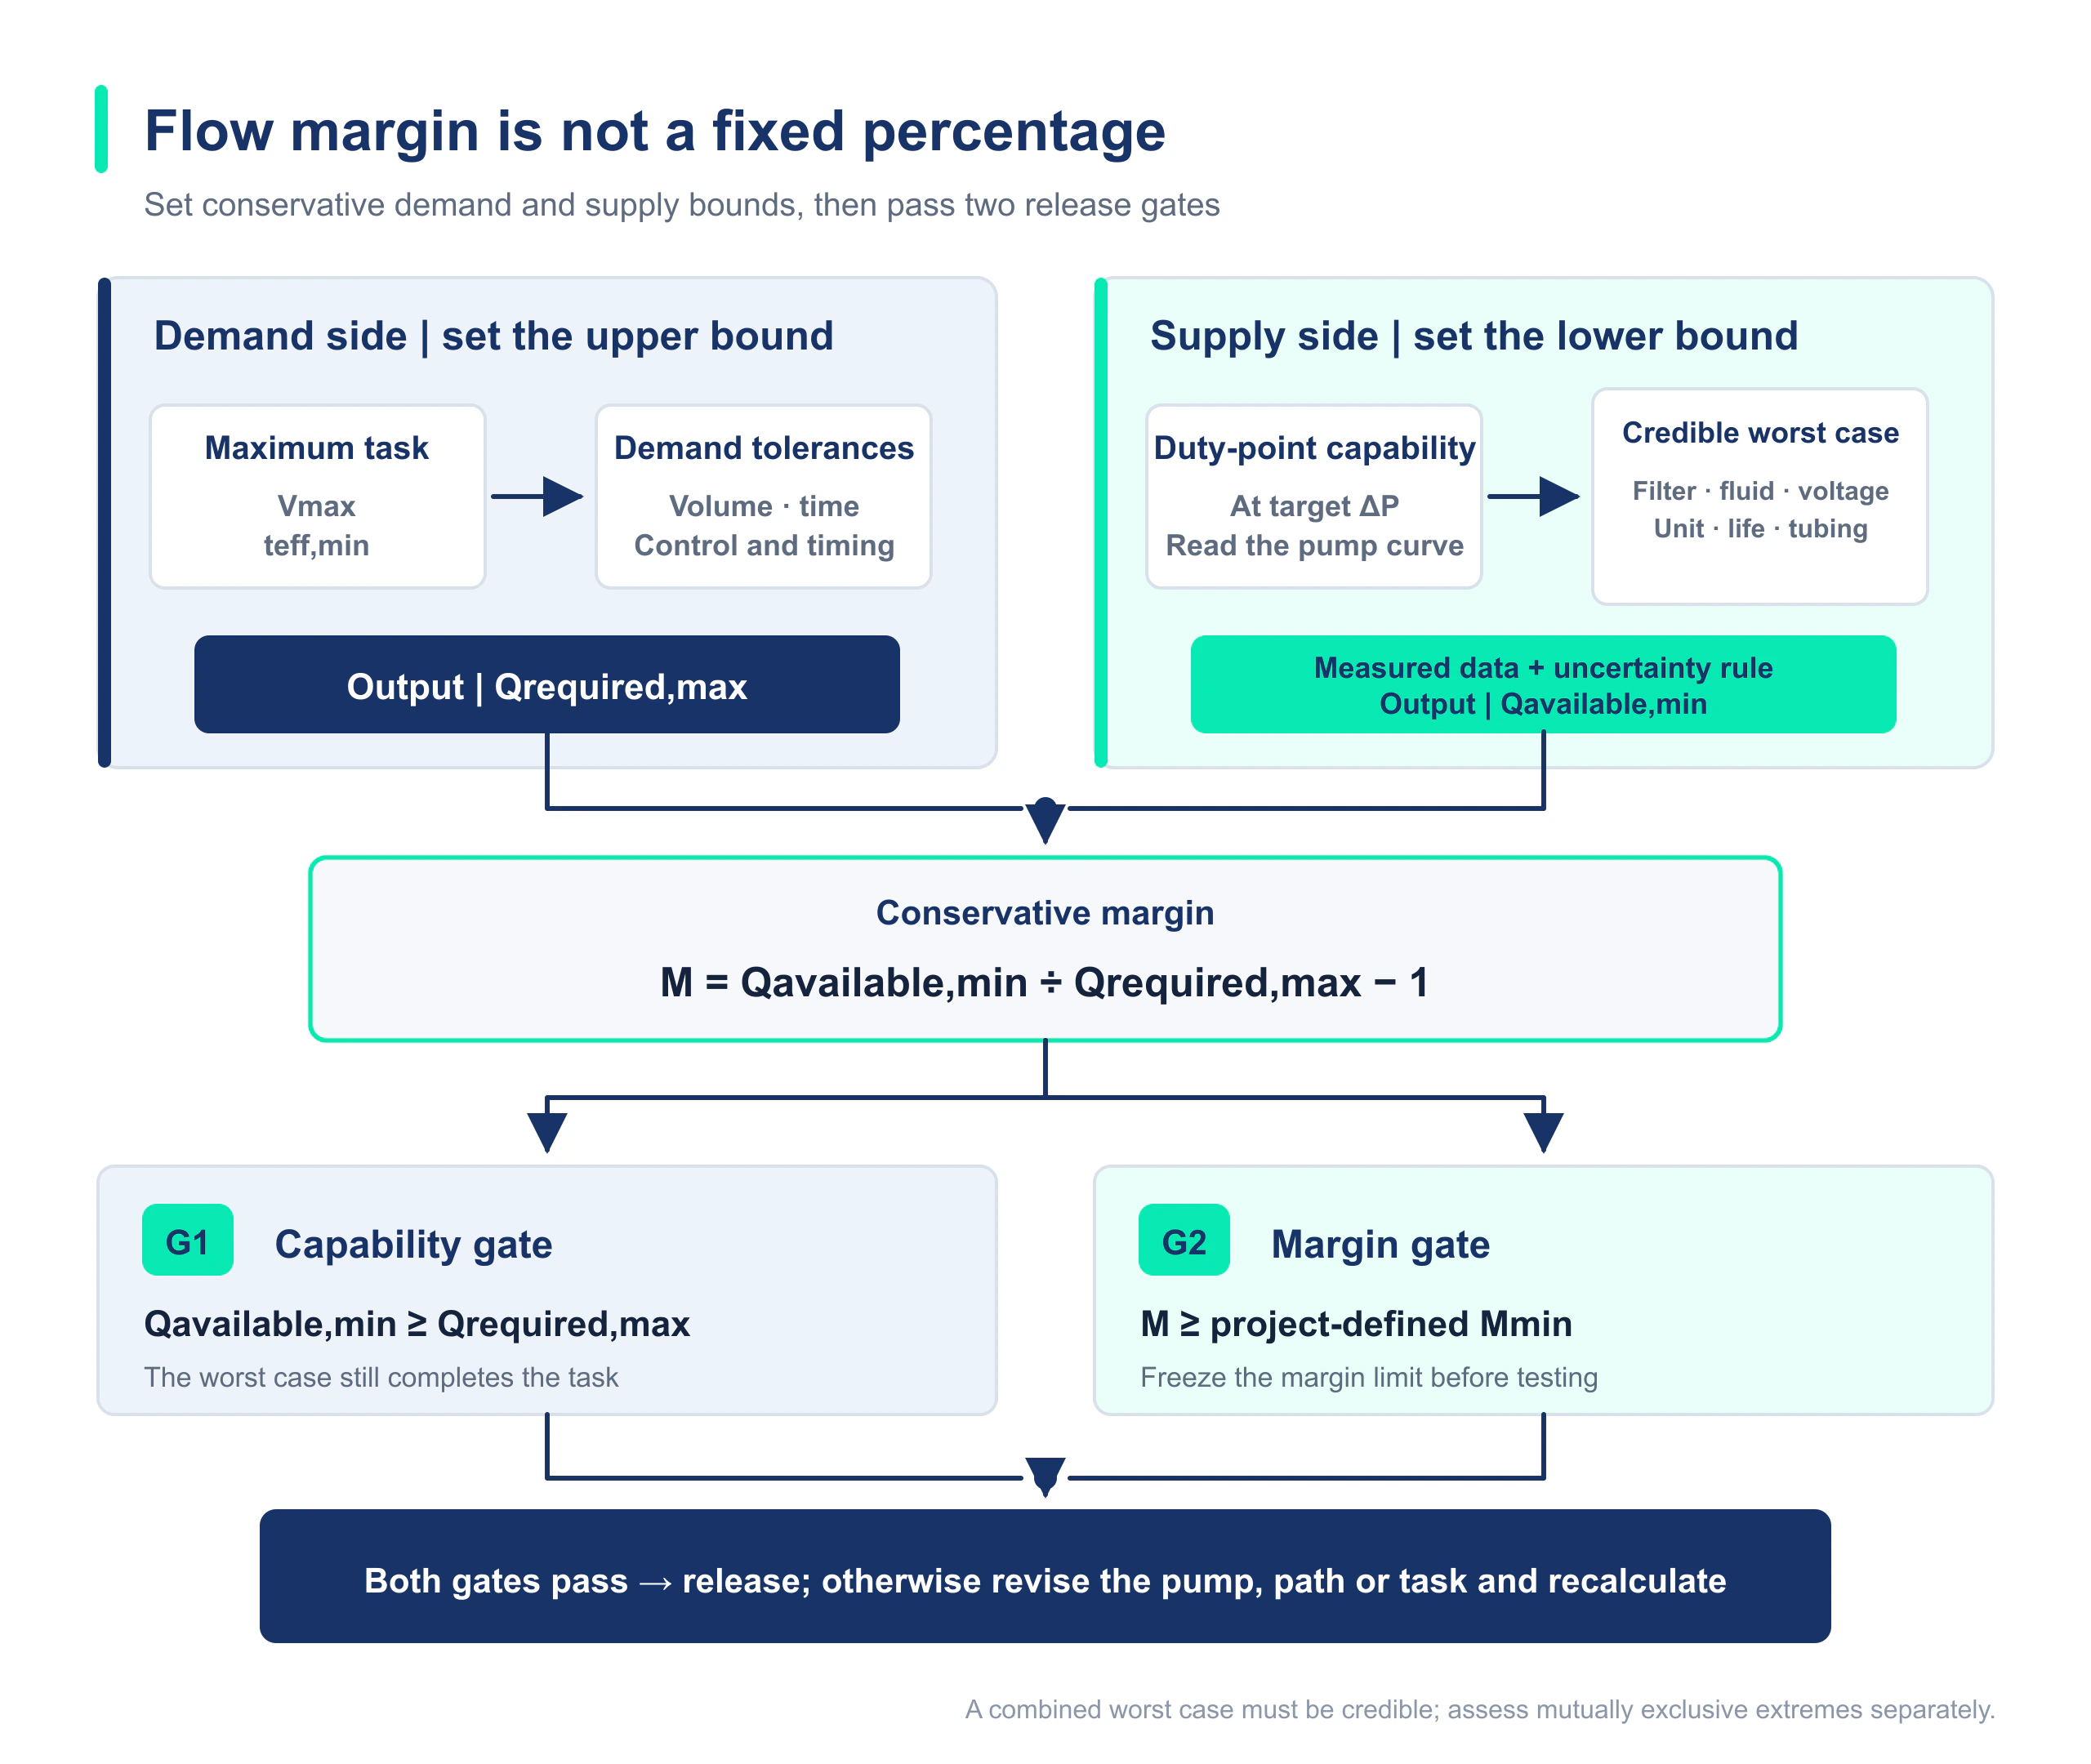
Margin analysis includes both an increase on the demand side and a decrease on the supply side. The demand side must cover the maximum task volume, shortest effective time and permissible tolerances. The supply side must cover actual pressure, power supply, fluid, filter condition, sample variation and life stage.
2. Express Margin as a Verifiable Relationship
M = Qavailable,worst ÷ Qrequired,max − 1Qavailable,worst should come from a curve or measurement at the specified pressure and in the worst-case scenario; the free-flow value of 300 mL/min cannot be used. Qrequired,max should be determined from the maximum task volume, shortest effective pumping time and demand tolerances.The M produced by this formula belongs only to the defined scenario. If the fluid-path version, filter condition, fluid, pump control or environmental limits change, recalculate or retest. A percentage obtained for one instrument cannot simply be copied to another.
3. ‘Worst Conditions Occurring Together’ Must Describe One Credible Scenario
A worst-case scenario is not a mechanical combination of every extreme value in a table. It should describe a set of conditions that can actually occur together at a particular operating stage, life-cycle state and environmental condition, and it should explain why each condition can coexist. Mutually exclusive limits should be separated into different scenarios for evaluation.
| Scenario treatment | Example | Evaluation method |
|---|---|---|
| Can be combined | The specification permits the instrument to start at low temperature, minimum voltage at the pump terminals, minimum liquid level and with the filter near its replacement point | Test as a substantiated end-of-life, low-temperature starting scenario |
| Should be evaluated separately | Low-temperature high viscosity and maximum fluid temperature are mutually exclusive environmental limits | Create separate low-temperature and high-temperature scenarios rather than adding them in one calculation |
| More evidence required | Pump-life degradation, the lowest-performing sample and extreme tube-diameter tolerance are all multiplied as point worst cases | Confirm statistical correlation, sample coverage and the source of each tolerance before defining a conservative boundary |
4. Which Factors Consume Flow Margin?
| Factor | What to check | Why it consumes margin |
|---|---|---|
| Maximum instrument demand | Maximum volume, shortest effective time, peak stage and program tolerances | Average demand may underestimate the peak |
| System pressure | Inlet pressure, outlet pressure and total differential pressure at the target flow | Flow normally decreases as differential pressure rises |
| Filter condition | New-filter condition, loading curve and pressure drop near the replacement point | The operating point shifts toward lower flow as loading increases |
| Tubing and assembly | Actual inner diameter, length, bends, fitting bore and batch tolerances | A local restriction may become the dominant resistance |
| Fluid and environment | Viscosity, temperature, outgassing, particles and valve response | A published water curve may not represent the actual fluid |
| Power supply and control | Minimum voltage at the pump terminals, current limiting, PWM range and harness voltage drop | Speed and starting capability may decrease |
| Samples and life | Variation across multiple pumps, run-in, operating hours and performance trend | One initial sample cannot represent production variation and life stages |
| Measurement system | Flow method, sampling time, calibration, repeatability and environmental influence | Measurement uncertainty reduces the margin that can be demonstrated |
5. Include Measurement Uncertainty in the Acceptance Criteria
The same true flow can produce different results because of flow-meter accuracy, weighing resolution, density conversion, sampling time, pulsation and repeatability. Before testing, the project should define its uncertainty budget, coverage rules and decision rule instead of interpreting them only when a result approaches the limit.
Mconservative = Qavailable,lower ÷ Qrequired,upper − 1Qavailable,lower is derived from worst-case scenario test results together with the defined rules for measurement uncertainty, repeatability and sample coverage. Qrequired,upper includes task-volume, effective-time and control tolerances. The statistical confidence or engineering coverage rules for both bounds should be defined by the project in advance.| Release item | Recommended predefined criterion |
|---|---|
| Flow capability | Qavailable,lower ≥ Qrequired,upper; if the project also specifies a minimum margin Mminimum, Mconservative ≥ Mminimum must also be satisfied |
| Starting and self-priming | Achieve the project-defined success rate and maximum starting time in every specified scenario |
| Pressure boundary | Steady-state and permitted transient pressure do not exceed the permissible working boundary of any fluid-path component in the actual fluid and at the actual temperature |
| Electrical and temperature rise | Voltage at the pump terminals, current, drive protection and steady-state temperature rise all remain within design limits |
| Repeatability and sample coverage | The specified number of samples, repeats and life stages all meet the same criterion |
If the project uses a decision rule with a guard band, the guard-band size should come from measurement capability and the risk of an incorrect decision. No universal k value or fixed percentage suits every measurement system. The key is to make the rule traceable and reproducible and to freeze it before testing.
6. Illustrative Calculation: Raw Margin and Demonstrable Margin Are Different
The following values only illustrate the method; they are not measurements from a customer instrument or a Foreach product. Assume maximum demand is 180 mL/min. A candidate pump can provide 260 mL/min at rated voltage and the target backpressure. In one confirmed credible worst-case scenario, the lowest measured available flow is 230 mL/min.
Mraw = 230 ÷ 180 − 1 ≈ 27.8%Using the free-flow value of 300 mL/min directly would produce an apparent margin of 66.7%, but that value does not include system pressure or worst-case conditions.Now assume the project's established uncertainty rule gives an available-flow lower bound of 225 mL/min, while including task-volume and time tolerances gives a demand upper bound of 185 mL/min. The conservative margin is then approximately 21.6%. The project should compare 21.6% with the predefined Mminimum instead of choosing whichever conclusion from 27.8% or 66.7% appears more favorable.
Mconservative = 225 ÷ 185 − 1 ≈ 21.6%The 225 mL/min and 185 mL/min values are illustrative bounds. An actual project should use its own measurement capability, task tolerances, sample plan and decision rule.7. For a Foreach 300 mL/min-Class Pump, Start with Target Backpressure
Published Foreach data for the DPL30 list a free-flow rate of 300 mL/min, rated pressure of 100 kPa and self-priming lift of 6 mH₂O. Installed margin cannot be calculated as ‘300 minus target flow.’ Start with the formal curve at the target backpressure, then validate inlet pressure, outlet pressure and actual flow in the final fluid path.
Validation should be divided into three levels: baseline conditions, normal variation and worst-case scenarios. If the instrument must remain close to 300 mL/min at high backpressure, recheck the required pressure platform. Adding a percentage margin does not turn a free-flow endpoint into high-backpressure operating capability.
View theDPL30 liquid diaphragm pump.
8. Flow-Margin Test Matrix and Data Records
| Test dimension | Baseline level | Limit or life-stage level | Recommended output |
|---|---|---|---|
| Power supply | Rated voltage at the pump terminals | Lowest permissible voltage at the pump terminals | Flow, starting time and current |
| Filter | New component | Equivalent pressure drop near the replacement point | Filter differential pressure, pressure across the pump and flow |
| Liquid level | Typical or highest liquid level | Lowest permissible liquid level | Inlet pressure, first start and stabilization time |
| Fluid | Baseline fluid and temperature | Permissible viscosity, temperature and gas-content limits | Flow, bubbles, noise and valve response |
| Pump samples | Multiple initial samples | Low-performance samples or samples at a life stage | Mean, spread, trend and failure modes |
| Measurement system | Baseline measurement after calibration | Low flow, pulsation and long-duration sampling | Raw data, uncertainty and decision result |
Conclusion: Margin Must Be Demonstrated Jointly by Scenarios, Data and Criteria
A reasonable flow margin is neither ‘the larger the better’ nor a fixed rule-of-thumb percentage. It should answer three questions: how maximum demand was derived, why the worst-case scenario can occur, and how much demonstrable capability remains after measurement uncertainty is considered. Recording these conditions in the test matrix and release rules makes it clear which parts must be revalidated when the filter, tubing, fluid or control version changes.
FAQ | Flow Margin for a 300 mL/min Miniature Diaphragm Pump
Does a 300 mL/min pump inherently have 50% margin for a 200 mL/min requirement?
No. That calculation may apply only if the pump's conservative available flow is still 300 mL/min at the same target pressure, fluid, power supply and worst-case scenario, while the demand upper bound is 200 mL/min. A free-flow value cannot be used directly as available flow.
Can a 20%–30% margin be adopted directly as a company standard?
It can serve as a design reference that triggers detailed validation, but it should not be the sole release standard. A company standard should also specify principles for combining scenarios, fluid-path version, sample and life-stage coverage, measurement uncertainty, demand upper bound and explicit acceptance criteria.
Why should the filter be checked in a condition near its replacement point?
Filter pressure drop normally rises with loading, so the pump operating point may shift toward lower flow. Testing can use a filter from the actual life stage or reproduce the boundary with a substantiated equivalent pressure drop. A new filter alone cannot represent the long-term condition.
How can you demonstrate that multiple worst-case conditions can occur together?
Place them within one specific instrument state: the same life-cycle stage, environment, liquid level, filter condition, power supply and control program, and confirm that the product specification permits the combination. Mutually exclusive conditions should be separated into different scenarios, and extreme values without evidence of association should not be multiplied mechanically.
Can a measured flow exactly equal to the minimum requirement be judged acceptable?
Usually, equality of the readings alone is not enough. The predefined decision rule must also account for measurement uncertainty, repeatability, sample variation and demand tolerances. If the available-flow lower bound is below the demand upper bound, sufficient margin has not been demonstrated.