
Why Does a Diaphragm Pump Flow Totalizer Disagree with Collected Mass?
A fluctuating display and an incorrect total are different problems. Match collection windows and hydraulic conditions, convert mass using the real fluid density, then check storage changes, trailing liquid, reverse flow, range and sampling. Only an independent reference can establish whether filtering or damping improves measurement accuracy.
Define the same measured quantity
The meter measures liquid crossing its location; the balance measures liquid reaching the vessel. Tubing, a damper and a nozzle may separate them. Direct comparison is appropriate at steady state with unchanged storage; startup and stopping require accounting for stored volume, branches and trailing liquid.
Use density for the actual composition and temperature, and control evaporation, splash, exterior drops and timing error. Do not remove a backpressure component simply to collect liquid: that changes the pump's operating point.
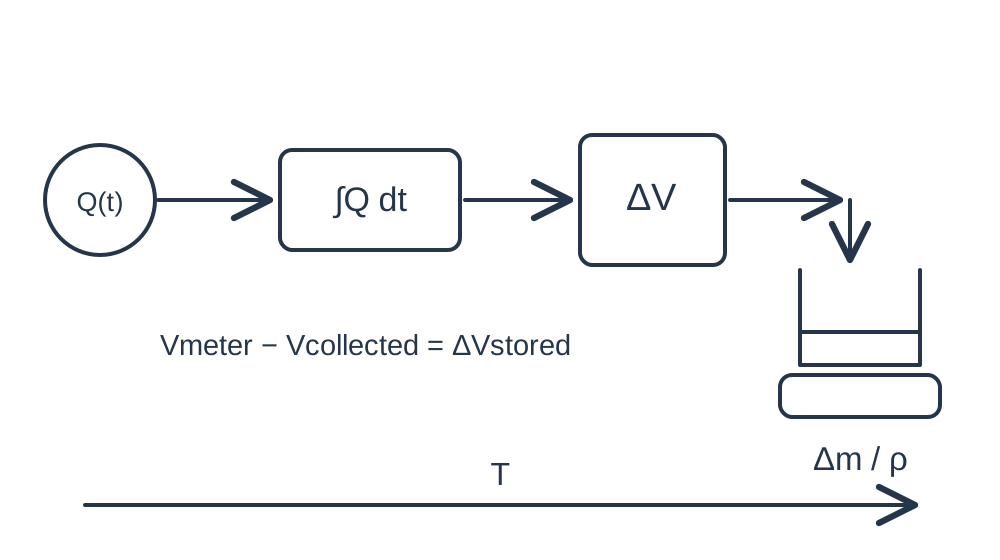
Apply a same-window volume balance
Align totalizer and collection start/end times and volume units. Without leakage, branches or phase change between sensor and vessel, their difference is explained by the change in stored liquid. More complex circuits require explicit branch and loss terms.
Repeat equal-length steady windows, then vary window duration. If the discrepancy shrinks with longer windows, inspect fixed timing offsets, storage and trailing liquid. Persistent relative bias calls for density, calibration, range and dynamic-suitability checks.
Qavg = 60 Δm / (ρ T); Vmeter − Vcollected = ΔVstoredFor Qavg in mL/min use Δm in g, ρ in g/mL and T in s. The balance assumes the same window, no branches/leaks/phase change, and a common density approximation between meter and vessel. At steady state ΔVstored≈0; start-stop tests include storage and trailing liquid.Check reverse-flow handling and peak saturation
Mean flow inside the rated range does not exclude instantaneous saturation. Short reverse flow may occur. A totalizer that counts only forward flow or clips negative values can read high; verify bidirectional capability and signed accumulation rules.
Follow the specific meter's requirements for a full pipe, fluid calibration, orientation, straight runs and pressure. Sensitivity to gas, viscosity and pulsation varies by measurement principle. One instrument's installation settings do not define every flow meter.
Separate sensing, communication and display filtering
Reading an unchanged output more often adds no information. Record sensor bandwidth, internal update/averaging, communication rate and external filters. Integrate with real timestamps; an arithmetic mean does not replace time averaging when intervals vary.
Repeatedly sampling the same waveform phase can create bias or apparent slow oscillation. Use windows covering multiple complete periods and verify anti-aliasing. Twice the highest frequency of interest is only a theoretical minimum, not assurance of accurate narrow peaks. The cited paper's abstract supports improved averaging for sampling error, not correction of saturation or sensor nonlinearity.
Choose filtering, damping or a different meter from the evidence
When totals match the mass reference and only the display jumps, tune display averaging while preserving fault-detection response. If totals also disagree, address range, bubbles, installation or processing first. Stronger filtering cannot restore information already lost.
After adding a damper, reweigh over the same window and task, including mean flow and trailing liquid. A flatter trace with unchanged total error requires further investigation. Pulsation settings in the cited KROHNE manual apply to that instrument, not universally to all sensors.
| Observation | Check first | Next action |
|---|---|---|
| Display varies; totals agree | Window and uncertainty | Set application-appropriate averaging |
| Short windows disagree more | Storage, timing and trailing liquid | Repeat complete start-stop cycle |
| Persistent high total | Reverse-flow sign, peaks and density | Correct settings and revalidate |
| Errors with bubbles | Full pipe and gas origin | Resolve gas before assessing meter |
| Damping steadies display | Mean flow and operating-point change | Recompare gravimetric bias |
Retain a reproducible measurement record
Save full pump model and control version, fluid temperature/density, reservoir level, tubing dimensions, backpressure, meter model/range/filtering, timestamps, raw output and mass records. Report per-window volume bias and uncertainty separately for steady and start-stop operation.
DPL30's 300 mL/min and DPL60's 600 mL/min are no-load flow levels, not installed-flow calibration standards. Evaluate the actual load using collected delivery. Sweep speed only on an explicitly supported control version; brushless alone does not establish adjustable speed.
Related reading and specifications
Technical references
Frequently asked questions
Does a jumping display mean the meter is faulty?
Not necessarily. It may reflect real pulsation or sampling/display behavior. Compare same-window totals with independent mass collection.
Does the average of ten readings represent true mean flow?
Not necessarily. Verify effective updates, phase coverage, actual time intervals and sensor dynamics; repeated reads of one output are not new samples.
Does a stable display after damping prove better accuracy?
No. Recompare same-window total, mass, operating point and stored-volume change.
Why is disagreement largest during startup?
Liquid may first fill tubing or the damper, so meter throughput and collected delivery differ temporarily. Check timing, branches, trailing liquid and density as well.