
Reducing Flow Pulsation in Miniature Diaphragm Pumps: Measurement and Practical Measures
Diagnose miniature diaphragm pump flow pulsation by separating real fluctuations from measurement errors. Compare damping, tubing and speed-control measures using matched operating conditions and endpoint measurements.
When a miniature diaphragm pump produces excessive flow pulsation, establish the actual waveform and accumulated delivery at the load first. Check suction, electrical supply and measurement problems before comparing damping, tubing or speed changes. A jumping flow-meter reading alone neither proves pump failure nor quantifies the actual pulsation amplitude.
Periodic delivery, declining accumulated output and distorted sampling need different responses. Evaluate the first against the application, investigate the operating point or fault behind the second, and correct the measurement chain for the third. Strong display filtering may merely make the number look steady.
Average and instantaneous flow answer different questions
Reciprocating displacement and valve operation produce time-varying outlet flow. Tubing, filters and the downstream load couple this flow to pressure changes. Phase-shifted multiple diaphragms or a compatible damping element are possible design approaches. Measure their effect at the actual load before specifying pulsation performance.
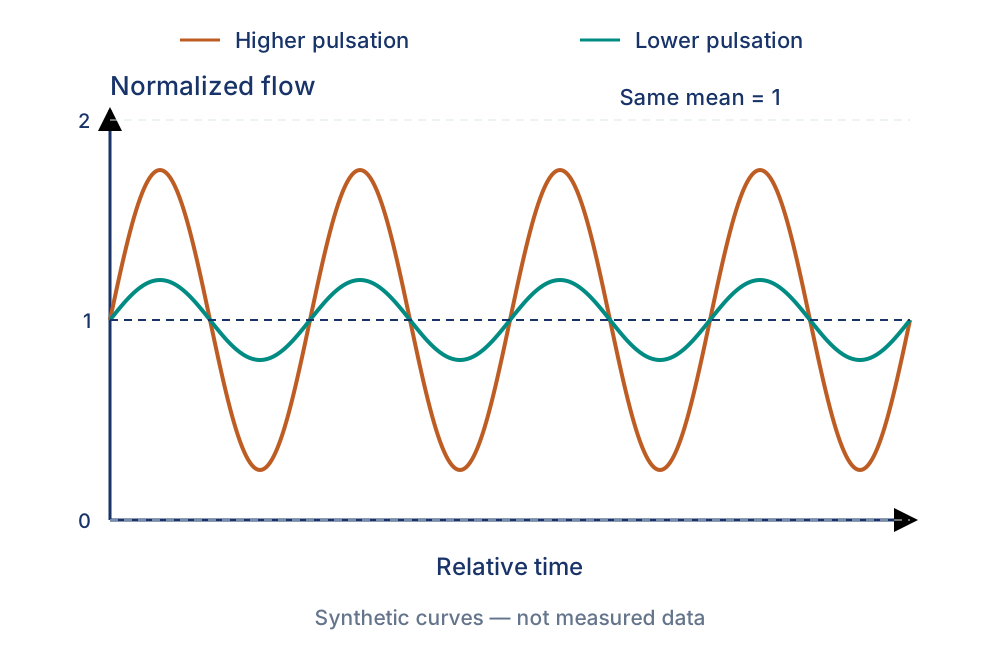
Average flow describes delivery over a selected time window. Instantaneous flow describes how that volume reaches the load. Waveforms can share an average but differ in peaks, gaps and short reverse-flow intervals. Reservoir refilling may chiefly depend on total volume; flow cells, short dispensing cycles and pressure-sensitive loads can also depend on the waveform.
Specify the measurement location and time window. Measurements close to the outlet and after a downstream damper are not equivalent comparison conditions.
Cross-check accumulated delivery before interpreting the waveform
Under the same hydraulic conditions, weigh the net liquid collected over a defined interval and convert mass to volume using density at the actual fluid temperature. Mass change over time is also the principle used by NIST's liquid-flow standard; its apparatus accuracy is not the accuracy of this suggested bench test. [N1]
With mass in g, density in g/mL and time in s, average flow in mL/min is 60 × net mass ÷ density ÷ collection time. Do not assume a density of 1 for non-water liquids. Account for evaporation, splashing and liquid retained on collection surfaces.
Match measurement boundaries. Comparing the meter's complete start-up interval against only steady-state collection is misleading. Removing a nozzle or backpressure element to collect liquid also changes the operating point. For steady flow, wait for pressure and stored liquid volume to stabilize and use identical windows. For start-stop tasks, include the full cycle, changes in tubing storage and post-stop discharge.
Repeat equal-duration windows and retain collected mass, meter total and pressure. Stable agreement supports consistent delivery, although the reading may still reflect real pulsation. Stable weighing with a shifting meter average calls for range, calibration, sampling and bubble checks. If both vary, investigate actual delivery changes.
Display refresh rate is not measurement bandwidth
The chain includes sensor response, internal sampling and averaging, communication reads, software filtering and screen refresh. These can operate on different timescales. Repeatedly reading the same measurement does not create new sample information.
Insufficient sampling of pulsating flow can cause aliasing. For a slowly updated display, acquire adequate samples within the effective bandwidth before averaging over the required window. Trigger mode, measurement duration and internal averaging affect acquisition; communication read rate alone does not establish measurement bandwidth.
Confirm dynamic response, calibrated fluid and usable range before selecting sample rate and anti-aliasing. Sampling above twice the highest frequency of interest is only a basic prerequisite, not proof that narrow peaks are measured accurately. Adequate sensor bandwidth and time resolution remain necessary; agree device settings with the meter supplier.
An average within range does not exclude peak saturation. If short reverse flow is possible, confirm bidirectional measurement and correctly signed integration.
Interpret the waveform alongside other signals
Record flow, inlet and outlet pressure, motor feedback or pump-terminal voltage on a common timebase. Transparent observation tubing helps locate bubbles, but their appearance alone cannot distinguish leakage, dissolved-gas release and local vapor formation. Check fluid calibration, sensor response to high-frequency pulsation, bubbles and mechanical disturbance together, so that measurement errors are not mistaken for actual changes in pump delivery.
| Observation | First check | Possible direction |
|---|---|---|
| Consistent period and stable total | Compare speed and pressure synchronously | Pumping cycle and circuit dynamics |
| Intermittent gaps with bubbles | First bubble location and inlet pressure | Leakage, insufficient supply or gas release |
| Lower average after adding a filter | Component pressure drop and pump operating point | Increased resistance or filter condition |
| Average changes with acquisition settings | Effective sampling, range and accumulated volume | Aliasing, saturation or processing |
| Flow changes with speed or voltage | Supply and control command | Electrical or control instability |
These are diagnostic clues, not one-to-one fault rules. A pressure peak cannot simply be converted to instantaneous flow: dynamic resistance and measurement location affect the relationship.
Damping changes response as well as pulsation
If delivery and measurement are sound but the load cannot tolerate the waveform, assess a compatible damper, tubing compliance, permitted speed range or pump configuration. Dampers store and release liquid at different pressure phases. Select for working pressure, fluid, connections and available space.
Greater compliance can lengthen pressure build-up and release liquid after stopping. Longer soft tubing also changes resistance and priming volume. Recheck start-up, steady average flow and tail volume, not just waveform smoothness.
Speed changes require a new operating-point check. Valve response and effective displacement per cycle need not remain proportional at low speed. In closed-loop control, verify sampling, filtering and actuator dynamics so that the controller does not chase each pumping pulse and oscillate the motor command. Use only interfaces supported by the actual configuration.
Compare pulsation-reduction measures at the load
| Measure | Purpose | Recheck |
|---|---|---|
| Correct inlet leaks, poor supply or voltage variation | Remove abnormal fluctuations superimposed on cyclic pumping | Minimum level, bubbles, terminal voltage and total delivery |
| Add a compatible damper | Reduce actual pressure or flow variation at the load | Pressure rating, fluid, cleaning, start-up and tail volume |
| Change tubing compliance or position | Change the circuit's dynamic response | Pressure loss, fill volume and endpoint waveform |
| Adjust speed within its permitted range | Change pumping frequency and operating point | Valve response, required flow, sampling and loop stability |
| Compare pumping structures or configurations | Change pulsation at its source | Matched-task measurements, rather than motor type alone |
Define low pulsation for a specific fluid, flow, backpressure, location and bandwidth. Record the allowed variation and calculation method; a strongly filtered display is not a hydraulic performance specification.
Evaluate the Foreach DPL series under matched conditions
DPL30, DPL60 and DPL30H specifications provide no-load flow and flow-pressure curves for initial operating-point selection. These are not instantaneous pulsation curves and do not specify peak-to-peak amplitude, spectra or attenuation for each condition. [F1–F3]
DPL60's 600 mL/min value does not establish that it pulses more than DPL30. A brushless version is not automatically a low-pulsation version. Compare material combination, speed, suction state and downstream circuit under the same conditions.
Retain average flow and window duration, instantaneous peaks and troughs, pressure waveform, effective bandwidth, load measurement point, temperature, bubbles and complete model designation. Acceptance must come from the instrument's flow, pressure and volume requirements rather than an unexplained universal percentage.
Specifications and references
Product parameters in this article come from the Foreach specifications below. Verify engineering explanations and proposed tests for the exact model and actual operating conditions.
[F1] Foreach DPL30 Chinese specification (A04)pp. 5–6: performance and configuration; pp. 3–4: mounting
[F2] Foreach DPL60 Chinese specification (A02)pp. 5–6: performance and configuration; pp. 3–4: mounting
[F3] Foreach DPL30H Chinese specification (A00)pp. 5–6: performance and configuration; pp. 3–4: mounting
Related selection and validation guides
Frequently asked questions
Does stable weighing prove that pulsation cannot affect the instrument?
No. It validates accumulated delivery, while short tasks and pressure-sensitive parts may still respond to instantaneous variation.
Will stronger flow-meter filtering solve the problem?
Filtering changes presentation and control delay; it does not directly remove real fluctuations. Compare raw data and totals.
Should a damper be added immediately?
First exclude air leakage, range and sampling errors. Then verify cleaning, filling, response and post-stop discharge with the damper.