
How to Read a Diaphragm Pump Flow-Pressure Curve—and Predict Installed Flow
A catalogue value such as 300 or 600 mL/min is not a fixed flow rate inside an instrument. The useful engineering question is: at the actual inlet pressure, outlet backpressure, fluid, tubing and supply voltage, where will the pump and the fluidic circuit settle?
The same pump can approach its nominal free-flow value with short tubing, water and little backpressure, yet deliver substantially less after a filter, narrow-bore tube, valve, needle or viscous reagent is added. That difference is often the expected result of pump performance and system resistance acting together—not evidence of a defective pump.
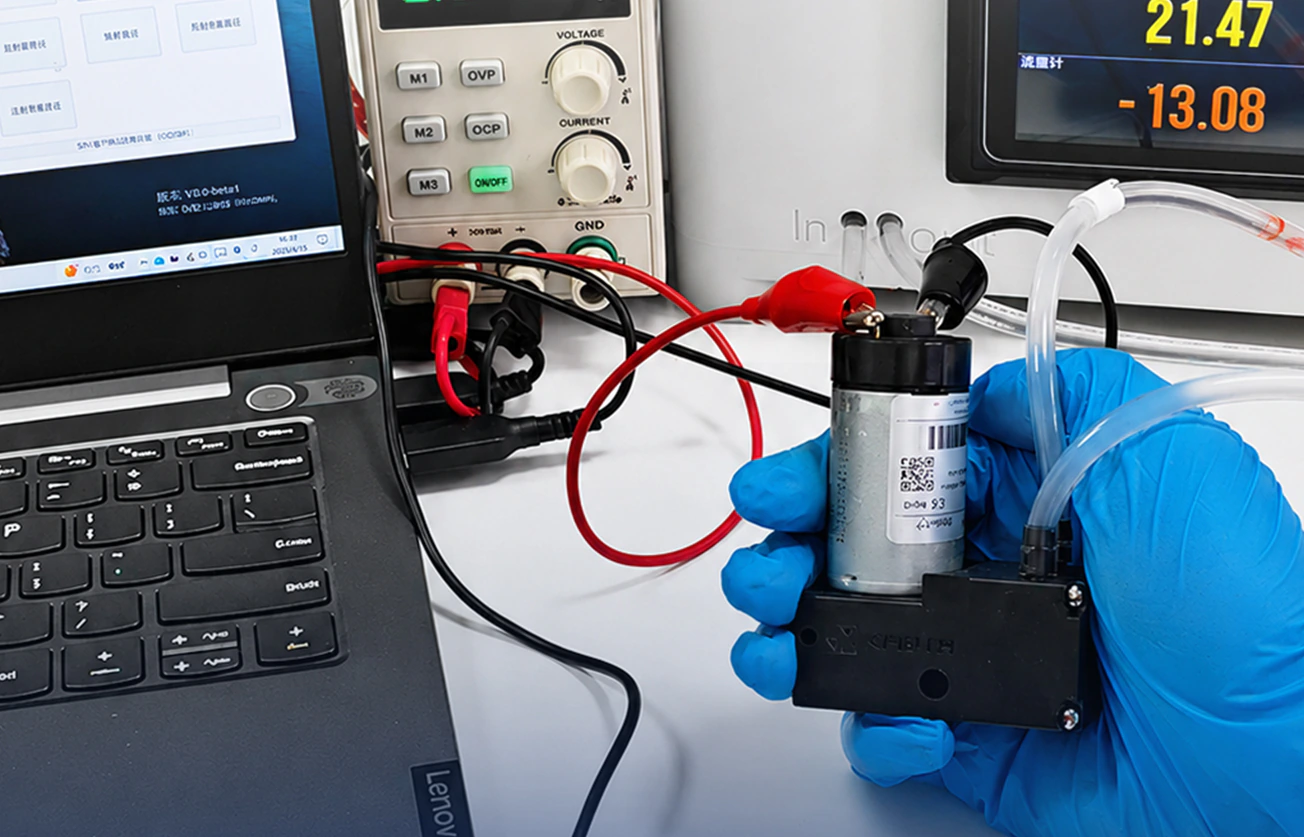
1. Start with the curve definition—not the headline flow value
A flow-pressure curve is a set of measurements produced under defined conditions. Curves cannot be compared responsibly until the supply, fluid, temperature, pressure reference, tubing and measurement method are aligned.
| Check | What must be defined | Typical mistake |
|---|---|---|
| Electrical supply | Rated voltage, voltage at the pump, current limit and PWM method | Comparing curves measured at different motor speeds |
| Test fluid | Fluid, viscosity, temperature, density and entrained gas | Using a water curve to predict a viscous or outgassing reagent |
| Pressure reference | Inlet vacuum or outlet gauge pressure, absolute or gauge, and tap location | Combining undefined inlet and outlet values |
| Fluid path | Tube ID and length, fittings, valves, filters and terminal restriction | Treating a low-resistance bench result as installed flow |
| Flow measurement | Gravimetric, volumetric or inline meter and averaging interval | Allowing pump pulsation to bias an instantaneous reading |
ΔPpump = Pout - PinThis pressure rise is useful for system analysis, but it can be read directly from a supplier curve only when the curve uses the same inlet/outlet test definition.2. Why flow falls as backpressure rises
A diaphragm pump creates flow by changing chamber volume and timing two check valves. A useful conceptual expression for average flow is:
Q = Vs × f × ηvAs outlet pressure rises, the diaphragm must work against a larger reaction force. Motor load and current can increase, effective stroke can change, valve opening can be delayed, and leakage or gas compression can reduce volumetric efficiency.
F = ΔP × ABackpressure does not simply squeeze the liquid. It changes force, valve timing, effective displacement and sometimes motor speed.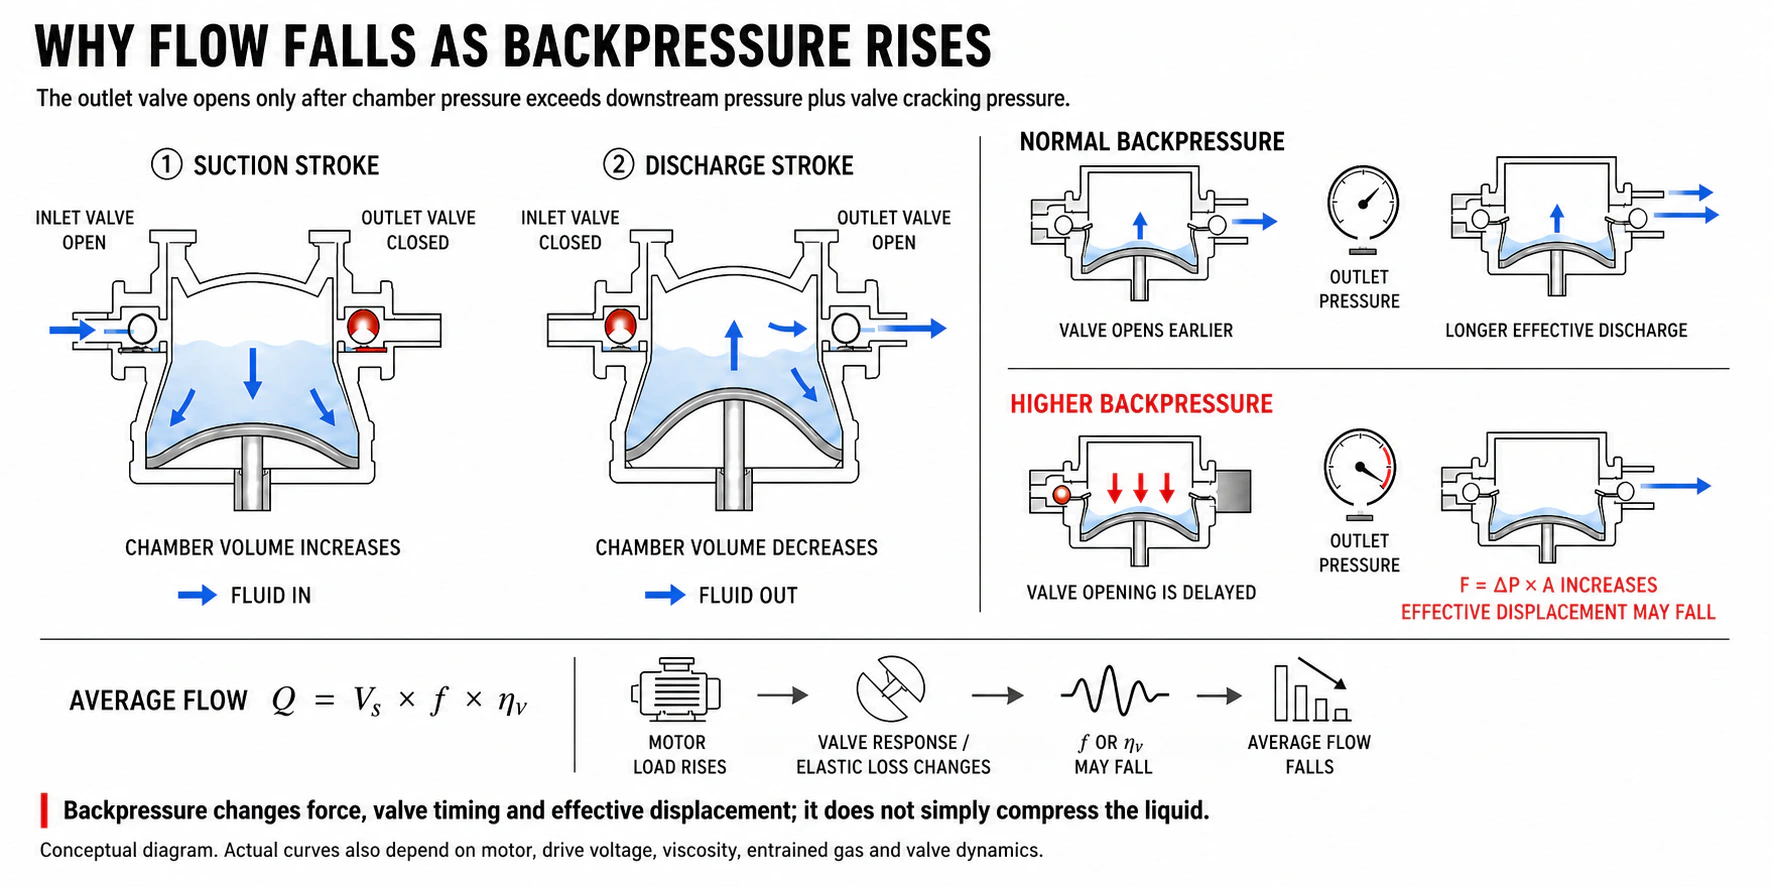
3. Build the system curve for the installed fluid path
The pump has a pump curve; the instrument has a system curve. At any target flow, the circuit must overcome static head, distributed tubing loss, local losses and terminal restrictions.
ΔPsystem = ΔPstatic + ΔPfriction + ΣΔPlocal + ΔPterminal| Pressure term | Typical source | Design input |
|---|---|---|
| Static | Liquid level difference or pressurized vessel | Density, elevation and vessel pressure |
| Tubing friction | Straight tube | ID, length, viscosity, velocity and flow regime |
| Local loss | Elbows, fittings, valves and area changes | Minimum bore and internal geometry |
| Terminal | Filter, needle, nozzle or membrane | Clean and end-of-life pressure drop |
ΔPstatic = ρgΔhΔPf = λ × (L / D) × (ρv² / 2)Re = ρvD / μDetermine the flow regime before selecting a friction-factor model; a single fixed factor is not valid for every miniature fluidic line.ΔPlocal = K × ρv² / 2For stable laminar flow in a circular tube, Hagen–Poiseuille makes the tube-diameter sensitivity especially clear:
ΔP = 128μLQ / (πD⁴)4. The operating point is where pump and system curves intersect
At a fixed voltage, speed and fluid, the pump curve generally slopes toward lower flow at higher differential pressure. The system curve rises because increasing flow requires more pressure across tubing, valves and restrictions. Their intersection is the installed operating point.
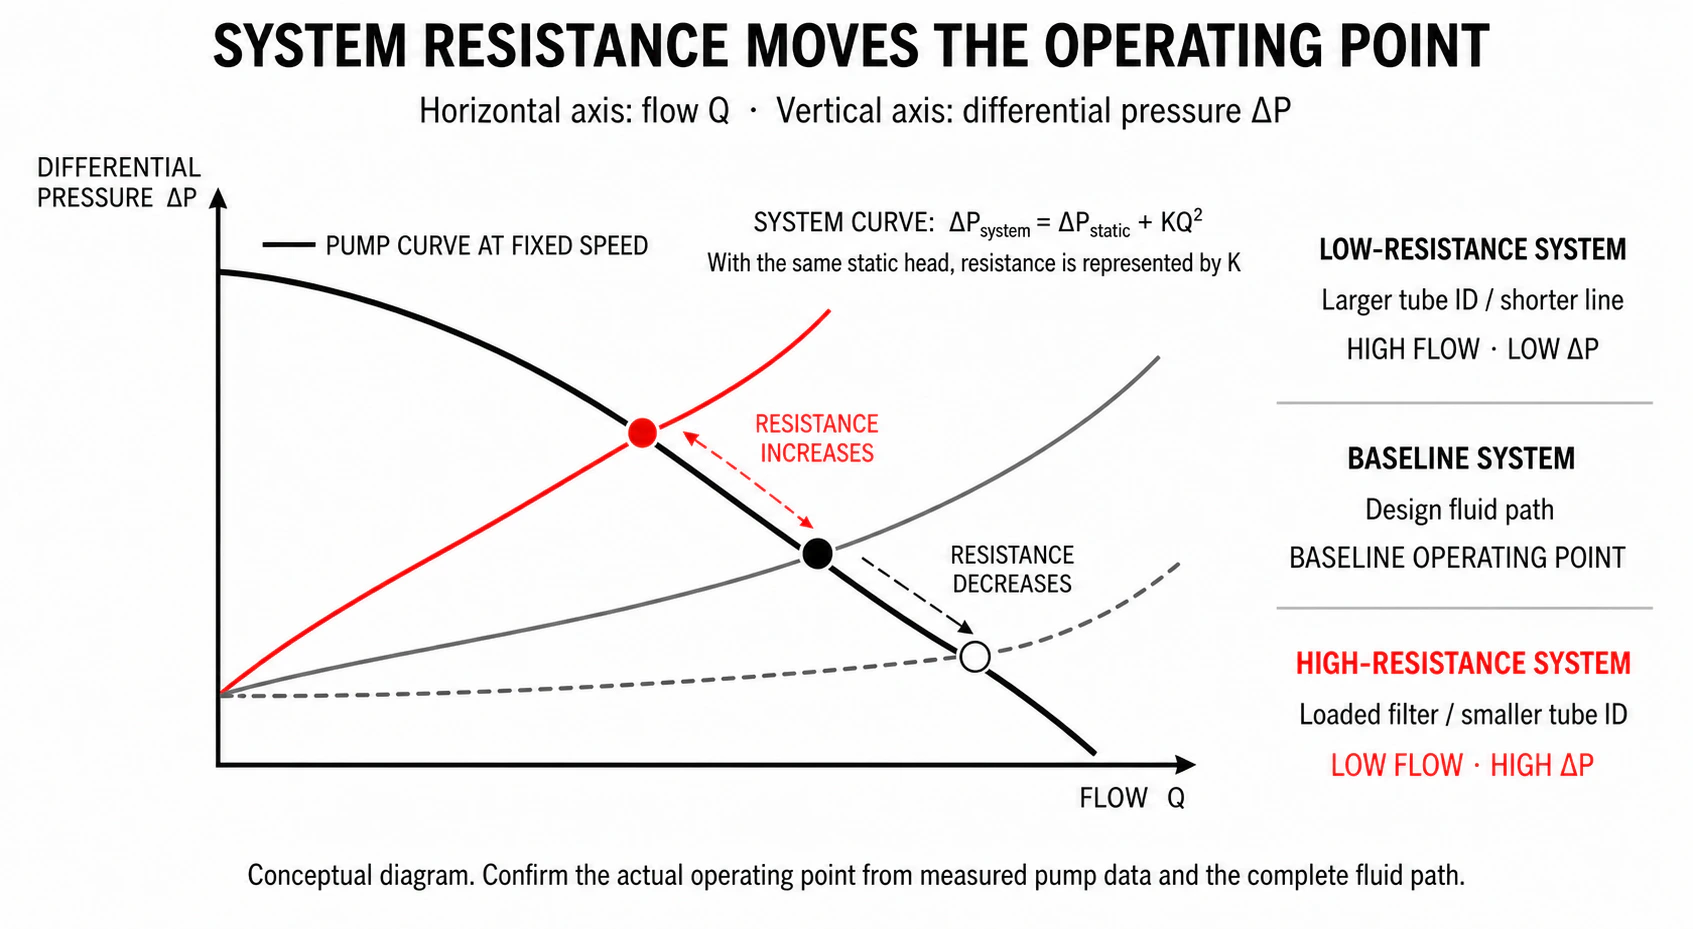
| Change | System response | Operating-point shift |
|---|---|---|
| Larger ID or shorter tubing | Lower pressure required at the same flow | Toward higher flow |
| Filter loading or narrower needle | Higher resistance | Toward lower flow and higher ΔP |
| Higher viscosity | Higher line and local losses | Lower flow; motor load may rise |
| Reduced PWM speed | Pump curve changes | A new lower-flow intersection |
| Inlet air leak | Two-phase flow and incomplete filling | Unstable flow; simple curve prediction degrades |
5. Why tube ID can dominate a low-flow circuit
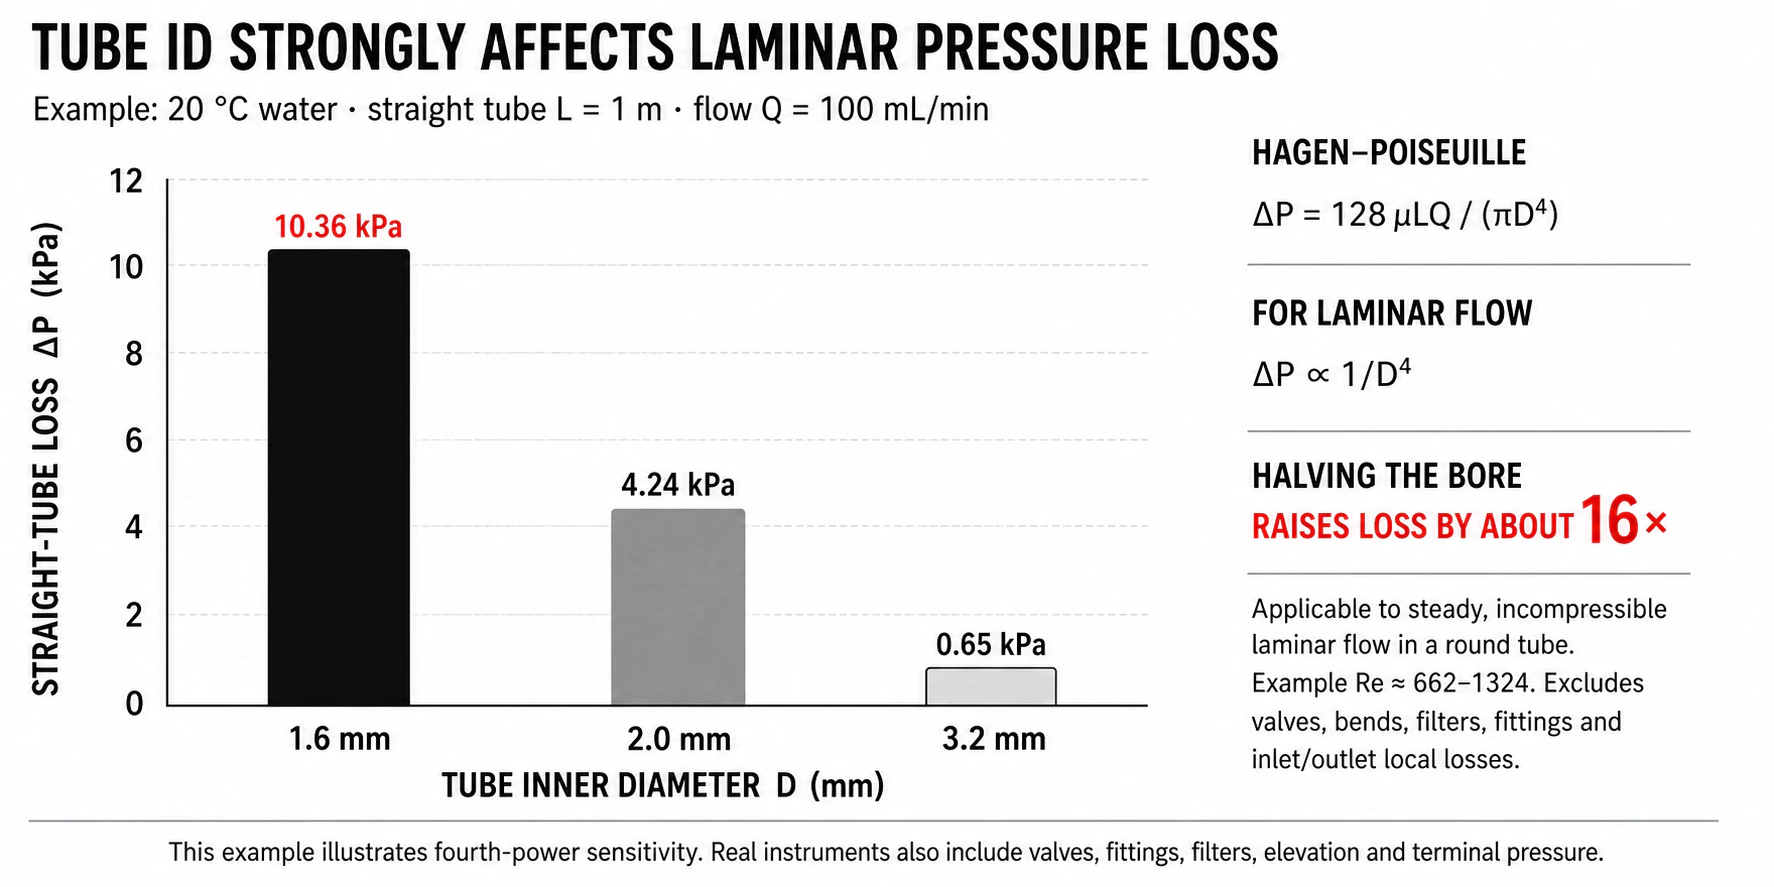
Consider 20 °C water, a 1 m straight tube and 100 mL/min, excluding fittings, filters, elevation and terminal pressure. All three cases below remain in the laminar range.
| Tube ID | Mean velocity | Re | 1 m tube loss | Relative to 3.2 mm |
|---|---|---|---|---|
| 1.6 mm | ≈0.829 m/s | ≈1324 | ≈10.36 kPa | ≈16× |
| 2.0 mm | ≈0.531 m/s | ≈1059 | ≈4.24 kPa | ≈6.55× |
| 3.2 mm | ≈0.207 m/s | ≈662 | ≈0.65 kPa | 1× |
6. An eight-point diagnostic for unexpectedly low installed flow
| Check | Typical symptom | Recommended verification |
|---|---|---|
| Test-condition mismatch | Pump passes alone but is low in the instrument | Align fluid, temperature, voltage and pressure taps |
| Air leak or incomplete priming | Bubbles, fluctuating flow, slow startup | Leak-test by sections; prime and vent consistently |
| Excess inlet restriction | Tube collapse, altered sound, poor lift | Measure inlet pressure and inspect suction-side ID, length and filter |
| Excess outlet backpressure | Higher current; flow changes with filter or valve state | Measure near the outlet and bypass components one at a time |
| Fluid or temperature change | Different result from water or at another temperature | Record viscosity, formulation and fluid temperature |
| Voltage drop or current limit | Supply setting looks correct but pump-terminal voltage falls | Log voltage and current at the pump under load |
| Assembly restriction | Kinked tube or connector inserted too far | Trace minimum bore and bend radius along the complete path |
| Unsuitable flow meter | Inline reading disagrees with collected mass | Cross-check gravimetrically and average over many pump cycles |
7. Use a repeatable test loop to confirm the installed point
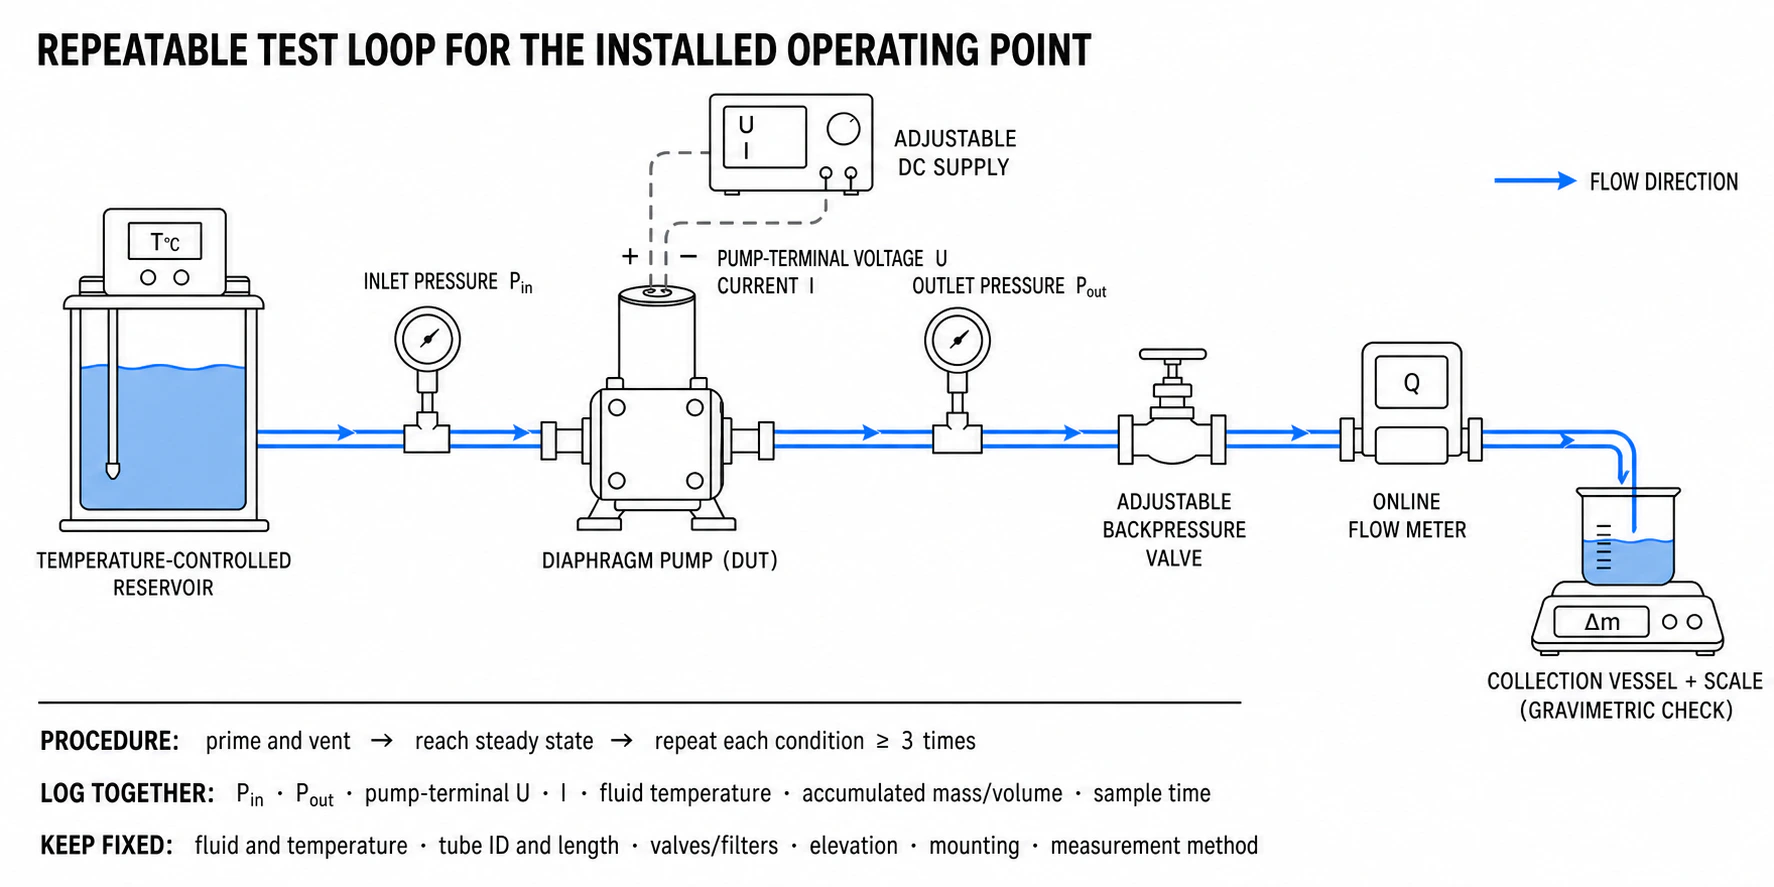
- Prime and vent the circuit using the same procedure for every run.
- Allow the pump, fluid and motor to reach the defined steady state.
- Fix tube ID and length, fittings, valves, filter state, elevation and measurement method.
- Record Pin, Pout, pump-terminal voltage, current, fluid temperature and sample time synchronously.
- Repeat every operating condition at least three times and retain raw data.
8. A practical selection workflow
- Define the required flow at the real operating pressure, not only a free-flow target.
- Define inlet and outlet pressure ranges, including startup and end-of-filter-life cases.
- Provide fluid, viscosity, temperature, gas content and material-compatibility requirements.
- Estimate the system curve from tubing, fittings, valves, filters, elevation and terminal restriction.
- Shortlist pumps whose measured curve leaves engineering margin at the intended point.
- Verify priming, flow, current, temperature rise, noise and repeatability in the complete instrument.
Review the DPL30 liquid diaphragm pump selection guide for a 300 mL/min-class example.
Compare the DPL60 liquid diaphragm pump guide for a higher-flow option.
Review the DPL30 300 mL/min liquid diaphragm pump series when the required operating point is in the lower-flow range.
Review the DPL60 600 mL/min liquid diaphragm pump series when the application needs a higher free-flow class.
For higher-backpressure circuits, review the DPL30H 600 kPa high-pressure liquid diaphragm pump series and verify the target flow on the controlled curve.
Conclusion: select the operating point, not the free-flow number
A flow-pressure curve becomes useful only when its test definition is matched to the instrument. The final flow is controlled by the pump curve, the system curve, the fluid and the electrical drive. Treat the catalogue flow as a boundary condition, calculate the circuit, then verify the installed operating point with synchronized pressure, electrical and accumulated-flow measurements.
Frequently asked questions
Why is installed diaphragm-pump flow lower than the datasheet value?
Datasheet flow is measured under stated conditions. Installed tubing, filters, valves, elevation, inlet vacuum, outlet backpressure, fluid viscosity, pump-terminal voltage and measurement method can all move the operating point.
Can I add inlet vacuum and outlet pressure and read one point from the curve?
Only if the supplier states that the curve was characterized for that same combined pressure definition. Otherwise confirm the curve method and test the real inlet and outlet conditions directly.
Does a 300 mL/min rating mean 300 mL/min at rated pressure?
Not necessarily. Free-flow, maximum-flow and rated-pressure values may describe different operating points. Use the measured curve to find the flow at the required pressure.
Why does a small reduction in tubing ID matter so much?
For stable laminar flow in a round tube, pressure loss scales approximately with 1/D⁴. Halving the bore can therefore increase ideal straight-tube loss by about sixteen times.
What should be measured during an installed-flow test?
Measure inlet and outlet pressure, pump-terminal voltage and current, fluid temperature, accumulated mass or volume and sampling time. Also fix tubing, valve, filter and priming conditions.